 Lingee Bench
Whitepaper
Abstract: Lingee Bench (code name lg-bench) is an agent evaluation benchmark oriented to enterprise business tasks and processes, answering one core question: given a well-defined business context and resource constraints, can an agent deliver verifiable business outcomes in business systems. The evaluation dataset is the core contribution: 500 general-domain tasks carry foundational capabilities and 900 enterprise-management-domain tasks (300 each for finance, supply chain, and manufacturing) carry business-process capabilities, 1,400 in total, with the organizational-collaboration tier reserved for future extension. The accompanying unified evaluation framework guarantees reproducibility: tasks are packaged in a unified directory format and executed offline in Docker environments with fully built-in dependencies, scored through the deterministic-rule and LLM-Judge dual channel into the Task Score, reported together with token-efficiency metrics and reliability@k stability. The benchmark consists of identically distributed public (first batch of 65 open-sourced tasks) and held-out groups; the gap between the two groups is monitored to measure contamination continuously, and version rotation keeps the benchmark fresh.
The first evaluation round completed a controlled comparison across Lingee, DeepSeek Harness, and OpenCode on the public group, with evaluation configurations fully disclosed as unified result cards under the seven-layer checklist; every score is attributed to the combination of “Agent × Harness × environment × evaluator” and neither evaluates other models or Harnesses nor converts directly into business value. This white paper presents the evaluation in action through in-depth analysis of six representative tasks (three general, three enterprise); two findings stand out: domain data access, not computing power, is the first watershed in enterprise business scenarios, and content correctness and delivery compliance are two independent capabilities that dual-channel scoring measures separately.
Keywords: agent evaluation; enterprise business tasks and processes; benchmark; Task Score; token efficiency; contamination prevention
1Business Problem and Benchmark Positioning
1.1 Enterprise Agent Adoption Trends and the Evaluation Gap
This round of intelligent-technology change stands at a critical juncture, and industry judgment is converging on two points of consensus. On the model side, the ceiling of intelligence keeps advancing rapidly, and AI is moving from solving “language” problems to solving “action” problems: autonomous agents that can understand and execute long-horizon, multi-step, cross-system tasks are seen as the next step toward industrial-grade reliable productivity, and frontier model vendors are shifting their R&D focus to long-horizon tasks and autonomous agent systems. On the enterprise side, the management-software industry is turning AI-native as a whole: AI is being upgraded from an add-on feature module to the system layer that carries business operations, and enterprise management is regarded as the main battlefield for agent adoption. As “letting agents take on core enterprise business” turns from vision into product promise, “how to objectively measure an agent’s real business capability” becomes a link in the chain that cannot be bypassed.
In enterprise-software settings, core management domains such as financial accounting, supply-chain planning, and manufacturing operations feature long processes, dense rules, and complex data relationships. They are both the highest-value landing zones for agents and the scenarios that place the highest demands on evaluation systems: whether an agent can “do the work of the enterprise” depends on whether it can understand vague requirements, locate the right data, execute compliant operations, and produce business-correct conclusions in real business systems. Kingdee, as an enterprise cloud management-software vendor whose business covers core management domains including finance, supply chain, and manufacturing, is naturally positioned to provide real enterprise evaluation scenarios and business-grade verdict standards.
Compared with adoption progress, evaluation systems lag notably behind. Existing evaluations mostly target general capabilities or code-engineering tasks and struggle to answer two basic questions. First, how to measure agents’ task-completion capability in real enterprise work scenarios — answering this presupposes a task dataset drawn from real enterprise work scenarios, which is precisely the scarcest resource today. Second, whether evaluation results are verifiable, reproducible, and comparable — the latest consensus in evaluation methodology is that an agent’s score is the joint product of four factor classes: model, Harness (execution scaffold), environment, and evaluator [1][2]; a public evaluation must be configuration-transparent and reproducible by others before its scores are attributable.
1.2 Limitations of Existing Agent Benchmarks
We systematically surveyed 37 industry evaluation leaderboards (see Appendix D for the full list), covering five categories: General Agent, Web/GUI, Code Engineering, Enterprise Office, and Aggregators. Two criteria governed the selection of survey targets:
- publicly verifiable — a paper, official documentation, or a public leaderboard page is available for checking;
- directly relevant to agent evaluation — the evaluation target is an agent or one of its core capability components.
Under these, coverage follows the five categories; we verified each item’s evaluation scenario, data open-sourcing, scoring method, and update status — the full list is in Appendix D. Public practice in professional work-product acceptance also offers a reference point: GDPval measures the real work products of 44 occupations through blind expert review [3], but its tasks come from US occupational scenarios and mostly one-shot assessment and do not cover ERP business chains — which also illustrates how such paradigms complement enterprise business-process evaluation. The survey shows three systematic gaps in existing benchmarks.
First, a blank in enterprise business depth. Only 5 items fall in the enterprise-office category, each with material weaknesses: OfficeBench is built on simulated office software rather than real business systems; the Salesforce CRM Benchmark’s code, data, and scorer are fully closed, so users cannot reproduce it themselves; WorkArena is based on the real ServiceNow platform but requires approval to access remote instances; DrBench targets deep-research scenarios; and AgentLab is an evaluation framework rather than an independent benchmark. None of them covers ERP core business chains such as financial vouchers, supply-chain planning, or manufacturing operations, and Chinese enterprise scenarios are an utter blank.
Second, business-grade validation is scarce. Of the 37 surveyed leaderboards, 32 release open datasets (including 2 partially open), but their verdict methods are dominated by generic matching (exact match, unit tests, state assertions); only 5 adopt LLM-as-judge (2 more partially). The “correctness” of enterprise tasks is usually defined by business rules, for example, whether a voucher’s debits and credits balance, and whether an inventory deduction matches the source document, rather than whether strings match. No surveyed benchmark has a mechanism of “business experts manually confirming expected outputs.”
Third, static benchmarks saturate quickly. In February 2026, OpenAI — a co-builder of SWE-bench Verified — published a task audit and announced it would no longer evaluate models on that benchmark [4]: of the 138 tasks that o3 failed to solve stably across 64 independent runs in its audit, about 60% had substantive problems such as overly narrow test definitions or flawed task statements and were effectively unsolvable; the mass scraping of public repositories also exposes tasks to training-data contamination, and top models’ scores have saturated around 80%. One-off static snapshots therefore have limited lifespans, and a benchmark must have a continuous-update mechanism.
In addition, Harness evaluation research indicates that on long-horizon tasks the score variance induced by Harness can reach 7.8 times the model variance, and leaderboards that do not disclose Harness configuration will misrecord scaffold gains as model progress [5]. Disclosure and reproducibility of evaluation configuration are becoming preconditions for evaluation credibility.
1.3 Positioning and Contributions of Lingee Bench
Lingee Bench (code name lg-bench) is an enterprise-grade, versioned agent evaluation suite built by Kingdee on real enterprise business: oriented to enterprise business tasks and processes, it provides a unified task system, evaluation framework, and controlled execution environment, and measures an agent’s ability to complete end-to-end tasks in an offline, controllable enterprise business environment (an ERP sandbox). The first evaluation round completed a controlled comparison on the 65-task public group across Lingee, DeepSeek Harness, OpenCode — three Harness configurations; every score is attributed to the combination of “Agent × Harness × environment × evaluator.” Locking the Harness improves within-combination comparability; one should not attribute a score to any single factor (see Section 5.3).
Released alongside this white paper are the following. First, version one of the evaluation task set: 500 general-domain tasks plus 900 enterprise-management-domain tasks (300 each for finance, supply chain, and manufacturing), 1,400 in total. To avoid contamination and overfitting from task leakage, the first batch of 65 tasks is open-sourced with task directories and Docker environment definitions and is reproducible offline; the remaining tasks are not directly open-sourced and are evaluated through the official Lingee Bench website. Second, a unified, reproducible evaluation framework and methodology — the subject of this paper (Chapter 4) — with four companion documents (evaluation protocol, held-out-set governance rules, scoring specification, and statistical reporting specification) to be released with the release version (see Appendix C). Third, task-level deep analysis (Chapter 5): six representative tasks drawn from the public group are analyzed one by one; the run results of the full 1,400 tasks and the 65-task comparison statistics are under review (see Appendix C).
Compared with industry benchmarks, Lingee Bench’s differentiation shows at three levels. At the scenario level, among the agent benchmarks already released by Chinese vendors (Tencent WorkBuddy Bench [6], ByteDance Multi-SWE-bench, Web-Bench, EdgeBench, Alibaba DeepPlanning, Huawei OmniBench, MiniMax OctoCodingBench, Zhipu VisualAgentBench, etc.), Lingee Bench is the only one whose scenario is ERP core business. At the validation level, the “deterministic rules + LLM Judge dual channel + business-expert-confirmed expected outputs” combination has no precedent among the 37 surveyed benchmarks; at the framework level, the execution environments of open-sourced tasks are fully self-contained and reproducible offline, evaluation configurations are disclosed in full, and held-out tasks are evaluated under control through the official website — avoiding the two common obstacles of closed evaluation and access-approval gates.
The core value and innovations behind this design can be summarized in four points. First, enterprise business depth: focused on ERP core business (finance, supply chain, manufacturing), with tasks drawn from real business work in these areas rather than generic tasks dressed up as business, and “business-grade correct” defined by business-expert-confirmed expected outputs, answering the question existing benchmarks cannot answer — whether an agent can take on real enterprise work. Second, identically distributed public/held-out dual groups: contamination prevention is turned from a static construction-time assumption into a continuously measurable signal (see Section 4.4), with the public group carrying reproducibility and the held-out group carrying credibility, structurally resolving the dilemma that “fully public is contamination-prone, fully secret is not reproducible.” Third, full locked-harness disclosure: a unified execution scaffold is locked and its configuration and inference parameters fully disclosed under the seven-layer checklist, making each score’s attribution combination (Agent × Harness × environment × evaluator) transparently checkable and within-combination comparisons consistent, systematically bringing the latest practices of evaluation-methodology research into the design of an enterprise-scenario benchmark. Fourth, a business-grade validation system: deterministic rules and the LLM Judge dual channel, combined with the five expected-result types, precision tolerances, and tool-chain verdicts, let open-ended business tasks also be reliably scored.
1.4 Intended Use and Applicability Boundaries of This Benchmark
This benchmark serves three use cases. First, product R&D and selection: controlled comparisons on the same evaluation assets plus failure-mode analysis, to decide whether to prioritize improving model capability, context organization, tool connectivity, control design, or interaction style. Second, customer procurement validation: customers and partners can run proofs of concept on public-group tasks and the accompanying evaluation environment, under familiar business tasks and unified acceptance rules, shortening the validation cycle of repeated demos and debate; tasks and acceptance rules can also be migrated to the customer’s own data following the plan in Chapter 6. Third, industry research and collaboration: researchers can reproduce evaluation results offline, examine the methodology and conclusions, and participate by contributing tasks or adapting tools (see Chapter 7).
Three boundaries apply when using this benchmark’s results. Results are bound to the evaluated combination and the evaluation-asset version; scores under different task versions or evaluation configurations are not directly comparable. The 65 public-group tasks carry the first-round evaluation runs and the six-task deep dives; case conclusions must not be extrapolated into quantitative inferences about the full distribution. This benchmark measures task and process capability in an offline sandbox; it does not directly answer online production performance, nor does it directly convert into business value (see Section 3.2, Section 5.3, and Chapter 6).
2Business Coverage and Task System
2.1 Design Principles
Lingee Bench’s design follows five principles. (1) Real-scenario driven: tasks come from real business and office scenarios and their reasonable abstraction, with scenario distribution close to real work frequency. (2) Verifiable outcomes: every task comes with expected outputs and validation rules, scored through the deterministic-rule validation and LLM Judge dual channel. (3) Reproducible: all data, tools, and dependencies required for evaluation are built into Docker images, external MCP and API calls are stripped away, and third parties can reproduce offline. (4) Contamination-resistant: tasks are reconstructed and synthesized from scenarios and public materials, task statements cannot be hit by web search, aided by version management. (5) Continuously evolving: tasks are continuously added and updated, and release snapshots iterate by version. The five principles are elaborated in later chapters: real scenarios in Chapters 2 and 5, verifiability in Section 4.3, reproducibility in Section 3.2, contamination resistance in Section 4.4, and continuous evolution in Sections 2.3 and 7.2.
2.2 Three-Tier Evaluation Architecture and Domain System
Lingee Bench organizes evaluation along the main line of “from task completion to business closure”: it measures not only whether an agent can complete isolated operations, but whether it can drive a business task chain in a business system to a verifiable correct final state. To this end, the benchmark organizes evaluation capability in three tiers, comprising the general domain and the enterprise management domain (Figure 1).
The first tier is foundational capability, carried by the general domain: verifiable professional work packages — multi-table reconciliation, supplier comparison, knowledge-base retrieval, document validation, schedule handling, and the like — serve as the unit of evaluation, measuring whether an agent’s foundational capability for supporting business is up to standard. The second tier is business process, carried by the enterprise management domain and the core of the first release: end-to-end business task chains in the system — from voucher entry to posting and closing, from order to goods receipt and issue — serve as the unit of evaluation, checking business artifacts, business states, and necessary controls at the same time, and measuring whether business tasks can close the loop. The third tier is organizational collaboration, oriented to sustained handling of business events across roles and over time, examining goal constraints, responsibility handover, continuous tracking, and human-machine collaboration; it is listed as an extension direction for later versions (see Chapter 8), and the number of agents itself is not an evaluation dimension.
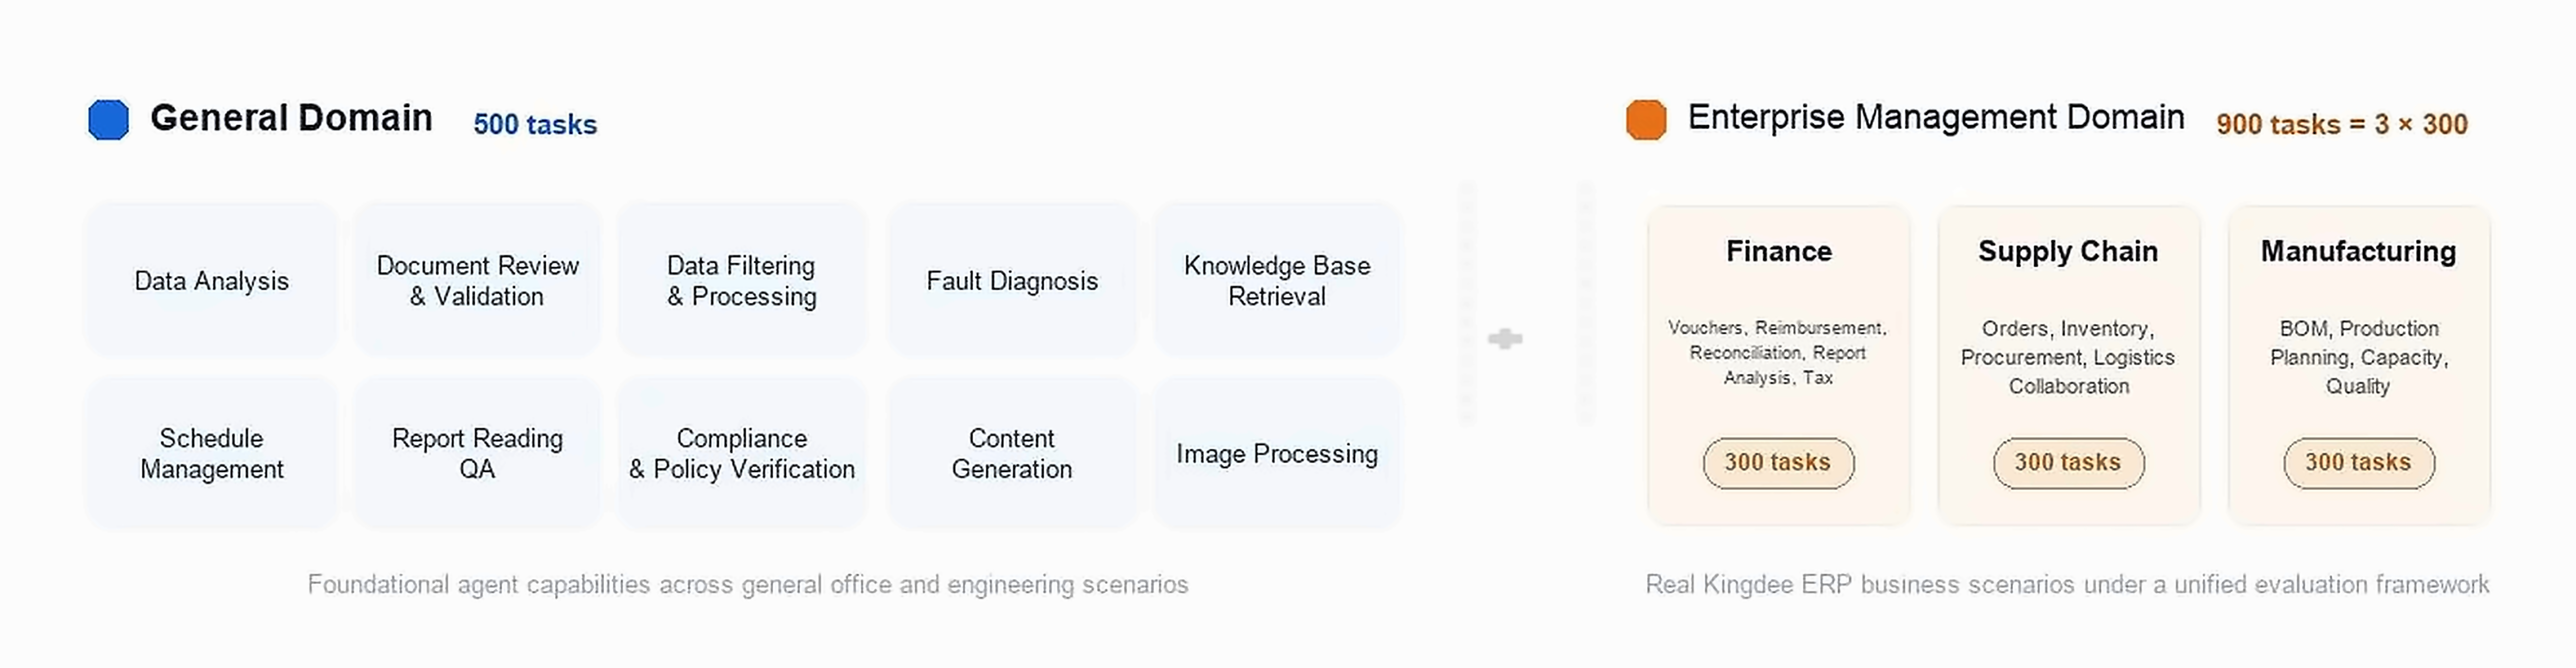
Figure 1 Composition of Lingee Bench’s two domains (1,400 tasks in total)
The two domains share the same task-directory specification and evaluation framework, with domain-pluggable scorers: general capability is assessed for breadth — adaptability across task types; enterprise scenarios for depth — compliance with business rules and cross-module process closure. The unified framework ensures consistent scoring definitions across domains, with domain differences appearing only in tasks and validation assets, not in the evaluation pipeline (see Sections 4.3 and 5.3).
2.3 Task Volume, Task Families, and Distribution Guarantees
The benchmark has 1,400 tasks in total: 500 in the general domain and 900 in the enterprise management domain, split evenly across finance, supply chain, and manufacturing at 300 each. On openness policy, the first batch of 65 open-sourced tasks forms the public group; the remaining 1,335 form the held-out group, evaluated through the official Lingee Bench website; the two groups are identically distributed (see Section 4.4). The 65 public-group tasks lie within the full 1,400 and were drawn by stratified sampling on scenario category, operation type, and difficulty tier following the three-step procedure in Section 4.4, and frozen together with the question-set freeze. The first-round evaluation runs and the six-task deep dives were all produced on this same public group and compared on the same set, not mixed with full-set reporting (see Chapter 5). The general domain’s ten-category composition (public group) is shown in Table 1.
Table 1 Composition of the ten general-domain categories (public group)
| Category | Tasks | Share | Example tasks |
|---|---|---|---|
| Data Analysis | 5 | 8% | Cost overrun attribution drill-down; region quarter-over-quarter business analysis |
| Document Review & Validation | 5 | 8% | Compliance red-line term scanning; multi-turn contract clause risk review |
| Data Filtering & Processing | 4 | 6% | Financial intelligence screening; expense-control SQL query |
| Fault Diagnosis | 4 | 6% | Error root-cause multi-hop localization; incident escalation handling |
| Knowledge Base Retrieval | 4 | 6% | Invoice-receipt auto-fill retrieval; refund reversal chain tracing |
| Schedule Management | 3 | 5% | Meeting-date policy checking; cross-timezone meeting conversion |
| Report Reading QA | 3 | 5% | Annual-report capex-ratio QA; ESG report reading QA |
| Compliance & Policy Verification | 3 | 5% | Line-by-line expense compliance checking; line-by-line requirement feasibility response |
| Content Generation | 2 | 3% | Multi-file merge and deduplication; template batch filling |
| Image Processing | 2 | 3% | Invoice–contract image reconciliation; batch recognition and posting of multiple invoices |
Enterprise-management-domain tasks require the Harness to operate the simulated ERP professional-system MCP tool interfaces built into the image, focusing more on examining domain-specific knowledge, tools, and logical understanding within the scenario. The (public-group) tasks’ detailed composition is in Table 2. Across the full sample, the three dimensions have 300 tasks each, split evenly; scenario distribution and composition within each dimension follow the four-dimension allocation framework of Section 2.5.2.
Table 2 Composition of the enterprise management domain (public group)
| Dimension | Tasks | Share | Scenario focus | Rationale |
|---|---|---|---|---|
| Finance | 14 | 22% | Vouchers, expense reimbursement, reconciliation, report analysis, tax | Strongest data rigor and compliance constraints |
| Supply Chain | 9 | 14% | Orders, inventory, procurement, logistics collaboration | High planning and coordination complexity |
| Manufacturing | 7 | 11% | BOM, production planning, capacity, quality | Longest industrial-process chains |
Task volume alone is not sufficient evidence of business representativeness; representativeness is guaranteed by task-family coverage. Every task belongs to one task family — an independent business scenario under the same business goal that cannot substitute for another; template variants within a family count as one independent scenario and are not accumulated as independent tasks. Task distribution is controlled by the mix of scenario category, operation type, and difficulty tier (see Section 2.5.2), and de-duplication checks at intake quality inspection (de-duplicate when semantic duplication exceeds 80%, see Section 3.3) prevent near-duplicate tasks from inflating the volume. The detailed composition of the 1,400 tasks (task-family list; scenario and difficulty distribution per dimension) will be published with the release version.
2.4 General Domain
2.4.1 Positioning and Capability Categories
The general domain measures an agent’s foundational capabilities in general office and engineering scenarios, covering ten categories: Data Analysis, Document Review & Validation, Data Filtering & Processing, Fault Diagnosis, Knowledge Base Retrieval, Schedule Management, Report Reading QA, Compliance & Policy Verification, Content Generation, and Image Processing. The composition of each category is shown in Table 1 (Section 2.3).
2.4.2 Capability Category Descriptions
General-domain tasks are categorized by the capability they examine, not by task form or data source: Data Analysis examines attribution drill-down, comparative analysis, and forecasting on business data; Data Filtering & Processing examines cleaning, filtering, and querying of structured data, including SQL queries; Document Review & Validation examines rule checking and cross-verification of contract clauses, forms, and bills; Compliance & Policy Verification examines line-by-line checking of policies and identification of version conflicts; Report Reading QA examines reading comprehension and numeric computation over long reports; Knowledge Base Retrieval examines multi-hop retrieval and logical tracing in enterprise knowledge bases; Schedule Management examines constraint-laden scheduling and cross-timezone conversion; Image Processing examines recognition and verification of bill and document images; Content Generation examines merging and batch production of templated documents; Fault Diagnosis examines root-cause localization and escalation handling of error messages.
2.4.3 Task Examples
Tasks are presented in a unified card format with five elements: task description (the colloquial original text), input assets, validation checkpoints, score composition, and underspecification design notes.
The following are three representative task cards, drawn from the Image Processing, Data Analysis, and Knowledge Base Retrieval categories and covering both single-turn and multi-turn task forms; the cross-Harness per-task comparison of the three tasks is in Section 5.2.
Example 1 Batch Recognition and Posting of Multiple Invoices (Image Processing · L2 · single-turn; task ID: IMG-multi-invoice-batch-recognition-L2)
Task description: Batch recognition and posting of multiple invoices: under input/ there are three separate invoice images to be recognized one by one and summarized. Recognize each invoice’s invoice number and gross amount (price plus tax), compute the grand total of the three, and write it into output.xlsx; none may be omitted.
Input assets: Three separate invoice images (invoice_1.png through invoice_3.png) and the task description task.json, all synthetic data; the environment runs offline with no network and no external interface calls.
Validation checkpoints: Recognition and standardized format of the three invoice numbers (INV-X-####, hyphens must be kept); the three gross amounts; the grand total equaling the sum of the three; the table structure of detail rows and the total row; per-invoice mapping of number and amount to the source image; required fields of result.json (produced_file, summary, format_check); no fabricated content, no banned words, no web links.
Score composition: A weighted combination of rule validation and LLM Judge, 50% each. Amount correctness is a fatal item — a wrong amount on any single invoice zeroes the whole task. The Judge rates five graded-level rubric items: amounts and totals, number format, table structure, source references, and no fabrication.
Underspecification design notes: The artifact layer enforces only a minimal contract — the detail table must contain at least the invoice-number and gross-amount columns; auxiliary columns and presentation are free. Amounts are checked under numeric equivalence: a numeric cell and a thousands-separated string count as the same amount. Recognition method is unrestricted; the task statement states explicitly that “evaluation only looks at whether the artifacts meet the contract and are business-correct; the tool-call chain inside the skill is an implementation detail and is not a scoring object.”
Example 2 Cost Overrun Attribution Drill-Down (Data Analysis · L3 · multi-turn; task ID: DA-cost-overrun-attribution-drilldown-L3)
Task description: Cost overrun attribution drill-down, in three turns — compute each department’s overrun rate → drill down to locate the overrun accounts → finalize a remediation plan. In turn 1, compute each department’s overrun rate as (actual − budget)/budget and identify the department with the largest overrun; in turn 2, drill into that department’s account details to locate the overrun accounts and amounts; in turn 3, give remediation calculations and recommendations for the main driver accounts. Each later turn must build on the previous turn’s conclusions rather than copy them, and each turn’s artifacts are written to disk per turn.
Input assets: Department budget vs. actual data dept.xlsx, account-level detail subject_detail.xlsx, task description task.json, and per-turn instructions turns/turn_1 to 3.md.
Validation checkpoints: Six rule groups — per-turn artifacts written under the directory contract (turn_1/dept.md, turn_2/drill.md, turn_3/plan.md); turn-1 overrun-rate computation and largest-overrun department; turn-2 overrun accounts and amounts; turn-3 remediation plan must contain calculated figures; the metrics and key_findings fields of result.json; the safety banned-words group. Three Judge graded-level rubric items verify the correctness of each turn’s conclusions.
Score composition: A weighted combination of rule validation and LLM Judge, with weights 70% and 30% respectively.
Underspecification design notes: The analysis targets of turns 2 and 3 do not appear in the task statement; they are determined dynamically by the conclusions of turns 1 and 2, so genuine cross-turn chaining is required rather than answering about pre-set targets. The turn-3 remediation advice is open-ended — multiple reasonable plans all score, and the verdict hinges on whether it targets the main driver accounts and provides calculated figures. Each turn’s artifact is Markdown with unconstrained structure.
Example 3 Refund Reversal Chain Tracing (Knowledge Base Retrieval · L4 · single-turn; task ID: KBR-refund-reversal-chain-tracing-L4)
Task description: A chain trace across two refund tickets: a supplier partial return needs a 2,000 CNY refund and a duplicated lodging expense needs a 1,500 CNY refund; trace step by step along seven interlocking questions (the refund mechanism and version patches, the two-step handling of reversal documents, the hidden amount field that caps the reversal and its formula verification, the auto-configuration of reimbursement checkboxes, the reverse operation on the employee self-service side, ordering the source articles by timeline, and summarizing general refund methods plus the closing verdict on the second ticket), marking sources as [article title] after key conclusions.
Input assets: A mirror of the Kingdee Cloud Community knowledge topic on “Renren Baoxiao / expense management” — 69 Markdown articles (file names are article IDs; the first line of each file is the article title); the business contexts of the two tickets are given in the task statement.
Validation checkpoints: Twenty-three rule groups verify the itemized conclusions of the seven questions — version numbers, patch numbers, go-live dates, formulas, parameter values, and day differences follow the knowledge-base originals, and computational questions must give numeric results. Six Judge graded-level rubric items verify semantic quality, including the two-step processing order, the hidden-field valuation rule, the attribution of refund methods and amount limits, the closing conclusion for the second ticket, citation grounding (source titles must really exist and point correctly; fabricated titles outside the list are forbidden), and no fabrication (inventing functions or parameters that do not exist in the knowledge base is forbidden).
Score composition: A weighted combination of rule validation and LLM Judge, 50% each. The evidence the Judge relies on is excerpted from knowledge-base originals and frozen before evaluation; the Judge does not access the workspace. The scoring configuration passes admission checks on three classes of samples: gold, baseline, and adversarial answers.
Underspecification design notes: The task statement gives no article titles, field names, or parameter names — the seven questions interlock, and the retrieval cue for the next question (a concept name, document name, or parameter name) often sits in articles read for earlier questions, so the next retrieval must be launched with terms from already-retrieved content. Articles on similar topics coexist, so sources must be distinguished and never mismatched. Content that cannot be found in the knowledge base may be honestly marked as “not mentioned in the knowledge base”; this is not treated as failure.
2.5 Enterprise Management Domain
2.5.1 Positioning and Design Approach
The enterprise management domain measures an agent’s ability to complete end-to-end business tasks in a real enterprise business system (the Kingdee ERP ecosystem). Compared with the general domain, it has three characteristics: business-data intensive (many tables, many documents, cross-period data relationships); processes crossing modules (the full chain of entry → review → posting → closing); and outcomes with business-grade right or wrong (defined by accounting standards and business rules, not surface text matching). The reasons for choosing the finance, supply-chain, and manufacturing dimensions: finance has the strongest data rigor and compliance constraints, supply chain has high planning and coordination complexity, and manufacturing has the longest industrial chains — together covering the typical difficulty spectrum of core enterprise-management domains.
Business domain and industry are two orthogonal dimensions: finance and supply chain are cross-industry business functions, while manufacturing is an industry scenario. The benchmark’s three dimensions cover the “function × industry” combination — the finance and supply-chain dimensions use the function as the main line to cover common business across industries, and the manufacturing dimension uses the manufacturing industry as the scenario to go deep into its production and operations business. Industries do not get separate, mutually duplicating task pools; instead, industry is a task-tag dimension in task metadata (see Section 2.6), supporting task slicing and statistics by industry, company size, role, process stage, and risk level; business capabilities shared across dimensions are shown as tags without double counting.
The enterprise-management-domain task set was designed and led by senior business experts with long, deep experience across enterprise-management business areas. Within their own fields of expertise, each expert independently authors and constructs tasks around high-difficulty research problems in real business scenarios, balancing high-frequency demands with critical long-tail scenarios, ensuring the tasks themselves carry sufficient business depth and a professional bar.
During task design, the experts take Kingdee’s years of accumulated ERP experience as the methodological foundation: on one hand, they go deep into frontline user scenarios and systematically sort out users’ real demands, operating habits, and business pain points; on the other hand, they benchmark industry-leading practices and distill the management experience and best practices of leading enterprises. The two cross-validate and reinforce each other, and are finally turned into a task set with clear structure, unambiguous semantics, and stratifiable difficulty.
The resulting enterprise-management-domain task set is not a simple compilation of tasks but a business data asset manually designed and refined by experts: every task carries clear business semantics, data shapes close to real business, and verifiable evaluation objectives. Rooted in practice and feeding back into practice, it can continuously support the evaluation and optimization of enterprise-grade intelligence.
2.5.2 The Four-Dimension Scenario Allocation Framework
Within the domain, scenario allocation is organized by business function module, with four dimensions guaranteeing systematic coverage.
Dimension one, business function: every function item (e.g., voucher entry, voucher review, voucher posting) has at least 1 task; high-frequency functions get 3–4; at least 1–2 end-to-end business chains are covered (e.g., voucher entry → review → posting → closing) rather than isolated functions; and function-boundary scenarios (when a user asks the agent to do something it does not support, it should correctly refuse or redirect) are included in coverage.
Dimension two, operation type: the four classes — query, operation, analysis, and document processing — are organized per the mix in Table 3, with no single operation type exceeding 50%.
Table 3 Operation types and descriptions
| Operation type | Description |
|---|---|
| Query | Information retrieval, balance queries, detail queries, etc. |
| Operation | Entry, review, posting, goods issue, etc. (minimum counts for each of create/approve/modify/delete) |
| Analysis | Trend analysis, comparative analysis, anomaly detection, etc. |
| Document processing | Printing, exporting, report generation, etc. |
Dimension three, difficulty tier: three levels defined on the two axes of execution complexity and cognitive complexity, with the mix in Table 4.
Table 4 Difficulty tier definitions
| Difficulty | Execution complexity | Cognitive complexity |
|---|---|---|
| Easy | Single-step operation within one function; no more than 3 interaction turns | Clear intent and complete information; completable in a single input |
| Medium | Multi-step operations across up to 2 functions; large data volumes need pagination or aggregation; 3–8 interaction turns | Implicit conditions require simple reasoning, or cross-period data comparison is involved |
| Hard | Multi-step, cross-function, full business chains; more than 8 interaction turns | Vague statements or multiple intents; requires deep business reasoning, risk confirmation, or correction |
Dimension four, exception handling: covering the four most common and most evaluation-worthy classes of exceptions in enterprise scenarios (Table 5), with at least 1 task per exception class per business module, to examine the agent’s robustness.
Table 5 Exception scenario types
| Exception type | Description | Design requirement |
|---|---|---|
| Business-rule violation | Unbalanced voucher debits/credits, expense amounts over limits, entry into a locked period, etc. | At least 1 task per business module |
| Empty result | No data matches the query conditions; should give a proper notice rather than an error | At least 1 task per business module |
| Abnormal state | Voided documents cannot be modified; approved vouchers cannot be directly deleted; etc. | At least 1 task per business module |
| Invalid input | Invalid customer numbers, wrong date formats, etc.; should validate and report | At least 1 task per business module |
2.5.3 Business-Grade Validation System
Validation in the enterprise management domain rests on dual assets: expected outputs (business-correct results) and validation rule files; all expected outputs are manually confirmed for accuracy by Kingdee’s business expert team. Expected results fall into one of five types (Table 6); precision and tolerance ranges are in Table 7.
Table 6 Expected result types
| Result type | Description | Example |
|---|---|---|
| Deterministic value | A single deterministic numeric or state result | The administrative-expense balance for September 2026 is CNY 125,000 |
| State change | A deterministic change of system state after the agent acts | A voucher changes from “unreviewed” to “reviewed” |
| Set | One or more result items matching the conditions are returned | Three customers are more than 90 days overdue: Company A, Company B, Company C |
| Operation confirmation | Deterministic success feedback for operation tasks | The expense report has been submitted successfully |
| Reasonable range | No unique answer; any value within the reasonable range counts as correct | Recommended payment method: either “bank transfer” or “online banking payment” counts as correct |
Table 7 Precision and tolerance ranges
| Data type | Precision requirement | Tolerance range |
|---|---|---|
| Amount | Two decimal places | ±0.01 CNY |
| Quantity | Two decimal places | ±0.01 |
| Percentage | Two decimal places | ±0.01% |
| Date | Exact to the day | No tolerance |
| Text | Exact match or semantic equivalence | Semantically identical is sufficient; case and punctuation differences are ignored |
Multi-answer handling rules: when multiple reasonable answers exist, giving any one reasonable answer counts as correct; when all qualifying items must be listed, nothing may be omitted — missing any one counts as partially correct; for ranking results, correct order is fully correct, and correct content in the wrong order partially correct; open-ended analysis does not require strict matching and is rated by the Judge on graded levels (excellent, pass, fail).
Take the hard scenario “something is off with this month’s books, please take a look”: the expected tool chain is to query the current-period voucher list → check abnormal vouchers (unbalanced debits/credits, unposted) → locate the specific problem → output the investigation results; the key decision point is whether the agent, upon finding the anomaly, proactively presents a problem list and asks whether to fix it; behavior such as skipping voucher-status checks and modifying directly is treated as partially correct.
2.5.4 Task Examples
Enterprise-domain task cards follow the unified card format and five-element structure of Section 2.4.3. The following three tasks belong to the finance, supply-chain, and manufacturing business modules respectively; all are completed through professional-system tool interfaces in a simulated Kingdee ERP business system and scored via a dual channel of content criteria (LLM Judge) and independent numeric rule verification; the cross-Harness per-task comparison of the three tasks is in Section 5.2.
Example 1 December Business Analysis Report (Finance · single-turn; task ID: finance-fa-20)
Task description: Generate a December 2024 business analysis report for the Galaxy Flagship Application Test organization. The data scope is the organization’s December 2024 balance sheet, income statement, and cash flow statement, supplemented by June 2024 account-balance materials; deliver a Markdown analysis report and an interactive HTML report, with the body covering 13 analysis topics including assets and liabilities, revenue, cash flow, and solvency.
Input assets: Simulated ERP business data of the organization “Galaxy Flagship Application Test” — the three financial statements, account balances, metadata, and dimension data — fetched on demand through the ERP professional-system MCP tool interfaces; default accounting system, currency CNY with amounts denominated in yuan; this task is read-only analysis.
Validation checkpoints: 16 content criteria — the 13 analysis topics checked item by item, with substantive requirements on topics such as asset quality and solvency (merely listing components does not pass); the interactive HTML report must contain displayable ECharts charts, card layout, and drawer navigation; every topic needs data-source annotations and timestamps; user-visible content must be desensitized. Four numeric verification groups — operating revenue; total assets, total liabilities, and asset-liability ratio; cash and cash equivalents; and net operating cash flow — are read from the specified “financial metrics value table” by table and column name; numbers in the body text are not a fallback source.
Score composition: A weighted combination of content criteria (LLM Judge) and numeric rule verification, with weights 70% and 30% respectively; numeric acceptance enforces the result-table contract — one metric per row, numeric cells contain only numbers, missing values are written as “cannot be computed,” and the same business key must agree across artifacts.
Underspecification design notes: The amount unit may be freely chosen among yuan, ten-thousand yuan, etc., as long as it is noted; correct conversion under the same currency counts as aligned. Synonymous titles or merged sections are allowed as long as each topic’s content can be located. When a topic lacks applicable data, state the gap and its impact — do not treat unobtained data as zero, and do not fabricate ratios or business reasons. The June supplementary materials and December statements must be listed in separate tables with their actual periods marked; definitions must not be mixed.
Example 2 January Sales Monthly Report (Supply Chain · single-turn; task ID: supply-chain-tc-059)
Task description: Generate the January 2026 sales monthly report, analyzing customer and material contributions, delivery exceptions, and collection risk, and give action recommendations for next month. Booking metrics are scoped to sales orders approved in January 2026 and assigned to the month by approval date; delivery-overdue judgments use the report cutoff of January 31, not the actual execution date.
Input assets: Sales business data of the personal view of the organization “Galaxy Flagship Application Test” — sales orders, delivery and return records, operating-metric data, etc. — fetched on demand through the ERP professional-system MCP tool interfaces; cross-currency data is presented per system report conventions, with each amount’s currency and unit identifiable.
Validation checkpoints: Three content criteria — order overview and customer/material contribution analysis; delivery-exception and collection-risk analysis (risk judgments must state the underlying business data, with a clear boundary between obtained facts and unobtained information); next-month action recommendations (must target the problems found in this report and be marked apart from established facts). Three numeric verification groups — booking amount, order count, on-time delivery rate, and return rate — are read from the specified “this month’s sales metrics” result table; body-text numbers are not a fallback source.
Score composition: A weighted combination of content criteria (LLM Judge) and numeric rule verification, with weights 60% and 40% respectively.
Underspecification design notes: The report medium is free — the full report may be delivered in the final reply, or as an HTML, Markdown, or Excel report file. Unobtained fields are written as “not provided” and never filled with zero; ratio computations must have a business basis, and denominators must not be back-derived from existing numbers. When order data lacks a salesperson, statistics use the organization scope with the limitation stated; the creator, reviewer, or logged-in user must not be guessed as the salesperson.
Example 3 Two-Day Process Quality Comparison (Manufacturing · single-turn; task ID: manufacturing-qc-029)
Task description: Compare process quality between October 3 and October 4, 2026 — what changed in first-inspection pass rate, patrol-inspection anomaly rate, and the top-5 defects. Tabulate all approved process inspection records for the two days, and deliver in the final reply three tables — the overall metrics table, the top-5 defect comparison table, and the process locator table — plus analysis; no files need to be written.
Input assets: Two days of process inspection records, with first inspection (in-house process inspection) and patrol inspection computed separately, fetched on demand through the ERP professional-system MCP tool interfaces. The statistical conventions are public — first inspection takes “inspection order number + production plan line” as the batch, and a batch passes only if all sampled results are B; patrol inspection is computed per record row, with a rejected quantity above zero counted as an anomaly; defects are counted by detail occurrences of handling type, not weighted by quantity.
Validation checkpoints: Four content criteria — coverage and definitions of the overall metrics table; the top-5 defect comparison table (covering the union of the two days’ top-five types, identifying additions, disappearances, and rank changes; types outside the top five are written as “not in top five,” with ties listed together); quality-change interpretation (judging with the total patrol record count whether anomaly count and rate move in the same direction, and distinguishing denominator changes from count changes); the process locator table (selecting processes by the public anomaly-rate-increase ranking rule, with attention reasons matching evidence). Six numeric verification groups — the two-day comparisons of first-inspection pass rate, patrol anomaly rate, total defects (optional), patrol record count, and anomalous patrol record count, plus the full locator data of the top two processes by anomaly-rate increase.
Score composition: A weighted combination of content criteria (LLM Judge) and numeric rule verification, with weights 60% and 40% respectively; ratios are compared exactly to one decimal place of a percentage and counts exactly as integers, with no rounding tolerance.
Underspecification design notes: The three tables have free column order and each item gives one set of primary results; total defects is optional and reported as is; when data is missing or the denominator is zero, write “cannot be computed” with the reason — unknown values are never replaced by zero. Numeric changes are October 4 minus October 3, subtracting the two days’ displayed values, and rankings use the percentage-point difference.
2.6 Task Construction and Task Directory Specification
Every task is packaged as a self-contained task directory using Harbor-style directory conventions. A task directory consists of three parts: task definition — instruction.md carries the natural-language task description, and task.toml declares task metadata and environment configuration in structured fields; execution environment — environment/ defines the Docker environment, and the task’s data assets are packaged as workspace.tar.gz and carried with the environment, unpacking into the agent-visible workspace; and scoring assets — tests/ holds the evaluation assets: verifier.toml and test.sh define the grading entry point, gold/ holds expected outputs, frozen evidence, and the three classes of admission samples, grading/ holds deterministic validation rules and grading scripts, and judge.yaml defines the Judge scoring rules. Evaluation assets and the agent are strictly isolated at execution time: during an Episode the agent sees only the task description and the workspace; validation assets are introduced by the evaluation pipeline only after the agent run ends. This isolation is architecturally enforced by the directory conventions and the pipeline, and is independent of release policy: validation rules are public, while expected outputs are confidential (see Appendix C).
Every task directory carries structured metadata including at least: task family and scenario category; industry and company-size tags; role and process stage; operation type and difficulty tier; business risk level; source and licensing notes; budgets (timeout, steps, tokens); a statement of allowed multiple solutions; pointers to the final-state verifier and interaction scripts; and known limitations. The metadata supports dimension-sliced statistics and distribution-mix checks (see Section 2.3) and is the data source for the task-family list and industry-tag statistics.
Task construction has five steps: scenario and data-source selection, colloquial task-description rewriting, underspecification design, validation-asset authoring, and quality inspection and intake. Two main threads run through the process. First, evaluability comes first: before a task is written, how it will be judged right or wrong must be settled; scenarios for which no decidable expected result can be defined are out of scope. Second, the real-user perspective: from wording to data, tasks follow how real users work, and are not simplified into exam-style statements for evaluation convenience.
Step one, scenario and data-source selection. The scope of authoring follows the domain scenario system: the general domain selects scenarios per the ten-category mix (see Sections 2.4.1 and 2.4.2); the enterprise management domain has business experts author tasks independently in real business scenarios, with coverage mixes across business function, operation type, difficulty tier, and exception handling under the four-dimension allocation framework (see Sections 2.5.1 and 2.5.2). Data sources follow a unified line: all evaluation data is synthesized from public materials, with no real enterprise data used (see Section 3.1). Two points deserve attention: first, align scenarios with the mix — high-frequency functions weighted up, critical long-tail scenarios not missed, every end-to-end business chain covered by at least one task; second, data foundations first — check the data a task depends on for completeness, validity, and verifiability (see Section 3.3), and hold off on scenarios whose data fails these three properties.
Step two, colloquial task-description rewriting. Scenarios are rewritten as user-voiced task descriptions under three norms: use natural Chinese user expression, not system-command or code-style wording; moderate information density close to real user habits, neither deliberately omitting necessary information nor over-elaborating; and restore the real business context rather than an isolated technical operation. Rewriting must distinguish vague intent from unclear intent: the former is a legitimate test point — “something is off with this month’s books, please take a look” mimics a user’s vague expression, but its evaluation intent is clear, examining whether the agent can recognize what “off” means in business terms (unbalanced debits/credits, an unclosed period, anomalous fluctuations), proactively clarify, and investigate step by step; such tasks go to the hard tier. The latter is unqualified wording — “handle this” leaves even the evaluator unsure of the target — and fails the semantic-clarity check at quality inspection.
Step three, underspecification design. The task description does not name target files, interfaces, or operation boundaries; the agent must locate them in the workspace itself, make reasonable assumptions about missing constraints, and clarify when appropriate — so that evaluation covers requirement understanding and localization, not instruction execution by numbers. The boundary of underspecification is guaranteed by validation assets: tasks with multiple reasonable answers must come with multi-answer verdict rules authored in sync (e.g., any one reasonable answer counts as correct, see Section 2.5.3), ensuring openness does not harm decidability.
Step four, validation-asset authoring. Three classes of validation assets are authored under each task’s tests/ directory: expected outputs (business-correct results falling into one of the five result types, with tolerances set per the precision-tolerance table, see Section 2.5.3), deterministic validation rule files, and Judge scoring rules (rubrics use graded-level design, see Section 4.3). The point of attention: the verdict logic is finalized together with the task — how right and wrong are decided is fixed when the task is written, not backfilled after results exist; in the enterprise management domain, all expected outputs are additionally confirmed item by item by Kingdee’s business expert team (see Section 3.3).
Step five, quality inspection and intake. Before intake, tasks pass item-by-item checks on seven dimensions — semantic clarity, intent completeness, unambiguity, business reasonableness, difficulty-label accuracy, naturalness of expression, and uniqueness — with three-grade disposition: pass and enter the pool; one or two dimensions below bar, return with revision notes for a timed fix; three or more below bar or business-unreasonable, return for redesign (details in Section 3.3). Tasks passing inspection are packaged as standard task directories and frozen together with the question-set freeze.
The field-level specification of task directories (formats of task metadata, scoring configuration, and validation rule files) and a complete example task directory are in Appendix F.
3Data, Environment, and Quality
3.1 Data Sources and Construction Method
Both domains follow a unified data source and construction method. All evaluation task-set data is synthesized from public materials, with blueprints and source material from Kingdee’s public materials: corporate financial reports (public structures such as the three statements, notes, and segment reports), ESG reports (public descriptions of business processes and management policies), and the Kingdee Community Help Center (product knowledge such as expense management and Renren Baoxiao); their publicity classification is in Table 8. On top of the blueprints, the data assets each domain needs are synthesized — office assets such as documents, spreadsheets, schedules, and images for the general domain; business assets such as tenants, customers, contracts, documents, and tickets for the enterprise management domain — following the principle of multiple tasks reusing the same underlying data to cut the benchmark’s storage and maintenance cost. Internal data sources (mock databases, desensitized business data) are used only for quality checks during authoring and are not released with the benchmark.
Table 8 Publicity classification of Kingdee data
| Data / knowledge source | Publicity class | Use |
|---|---|---|
| Kingdee Community Help Center (product knowledge such as expense management and Renren Baoxiao) | Publicly cited | General-domain source material (knowledge-base retrieval) |
| FAQ pages and official-site mirrors | Publicly cited | General-domain source material (knowledge-base retrieval) |
| Financial-report companion materials (public investor-relations disclosures) | Publicly cited | Structural blueprints for financial-analysis tasks |
| ESG reports | Publicly cited | Scenario blueprints for business-process and management-policy scenarios |
| Business database tables (tenants, customers, suppliers, contracts, documents, tickets, etc.) | Synthetic (mock) | Data assets for enterprise-management business-operation tasks |
| Business document templates (contract and report templates) | Synthetic (mock) | Assets for document-processing tasks |
Note: “publicly cited” means direct use of publicly available Kingdee materials; “synthetic (mock)” means data assets fictitiously constructed on top of public blueprints, corresponding to no real enterprise data; details of the synthetic data are subject to the release version.
Table 8 summarizes the Kingdee data used by this benchmark and its publicity classification: one class is Kingdee public materials cited directly (general-domain source material and scenario blueprints), and the other is mock data assets synthesized on top of public blueprints (the data basis of enterprise-management business-operation tasks). Details of both classes are subject to the release version.
3.2 Execution Environment and Reproducibility
The execution environment’s core convention is the fully self-contained Docker image: task data, tools, and dependencies are all packaged into the image, and external MCP and API call dependencies are stripped away. Three direct corollaries follow — it runs offline, third parties can reproduce it, and there is no approval gate. Capability boundaries must also be made clear. This benchmark measures task capability in an offline, controllable ERP sandbox: permissions and approval controls are covered by simulation inside the sandbox — the permission model and human approval points are configured per task and disclosed with the governance layer (see Section 5.1.2), unauthorized operations are fatal items (see Section 4.3), and abnormal-state tasks examine control constraints such as “reviewed vouchers may not be modified directly” (see Section 2.5.2); human-machine collaboration is carried by a unified simulated user for clarification interaction (see Section 5.1.5). Deliberately excluded are the online elements that connect to production systems — network access, real-time data, and real approval flows — an external-validity price paid for reproducibility; production online validation, plus deeper separation of duties, idempotency of repeated execution, and rollback-compensation coverage, are listed as extension tracks (see Chapter 8). The execution flow is: environment startup, agent run, artifact and log collection, final environment-state snapshot, and post-hoc validation.
Final-state scoring: scoring recognizes only the environment’s real final state and artifact logs, rejecting agent self-reports of success; the full trajectory is auditable after the fact [7]. Data independence: different tasks share no key test data; each task reserves an independent data copy or restore point, and where sharing is unavoidable the execution order is fixed — guaranteeing run stability and reproducible results. Timeout and budgets: task-level timeouts, step and token budgets, and failure-retry policies are configured per task and disclosed with the evaluation setup.
Clarification interaction protocol. Underspecified tasks allow the agent to ask the user for clarification, and the execution environment builds in a unified simulated user and response scripts for this: answer scope — the simulated user answers only the pre-planted clarifiable items of the task; response scripts are authored in sync with the validation assets and give no information beyond the task statement; waiting and timeout — clarification requests have a waiting cap, after which the agent must continue with explicit assumptions or be handled as incomplete; assumption rules — non-critical default parameters may be assumed by the agent but must be declared in the artifacts, while key business parameters (amounts, accounts, document objects, etc.) must be clarified before execution. The unified protocol ensures that when different agents face the same ambiguous request, choosing to clarify or proceed rests on capability judgment rather than differences in environment rules, and scoring treats both paths equally. The response-script library and timeout parameters are published with the Evaluation Protocol.
A response-script example takes the sample task “January Sales Monthly Report” (Section 2.5.4, Example 2). Its pre-planted clarifiable item is the statistical-scope attribution; the task statement says “when order data provides no salesperson, use the organization scope and state the limitation; the creator, reviewer, or logged-in user must not be guessed as the salesperson.” The corresponding Q&A: the agent asks “the order data has no salesperson field — over what scope should the monthly report tabulate?”, and the simulated user answers per script “tabulate over the current organization scope and state the limitation in the report”; if the agent asks a question not covered by the script, the simulated user responds only with a unified formula such as “go by the task statement,” giving no information beyond it. Both execution paths score equally: this task’s content criteria simultaneously check that “organization-scope tabulation with the stated limitation” is carried out, so clarify-then-execute and direct execution under the statement rule face the same criteria. Non-critical default parameters need no clarification — e.g., the sample task “December Business Analysis Report” allows free choice among yuan, ten-thousand yuan, etc., noted in the output; the agent may assume it and declare it in the artifacts.
Separation of feedback and measurement: no Harness or prompt tuning is done on the evaluation set; any tuning happens on a separate development subset, and the evaluation set stays held-out [8]. Run counts: each task runs multiple independent times, reporting means and reliability@k (see Section 4.2).
3.3 Quality Assurance System
Before intake, tasks pass item-by-item checks on seven dimensions: semantic clarity (exactly one reasonable reading), intent completeness (subject, action, object, and constraints all present), unambiguity (no unclear reference, polysemy, or fuzzy boundaries), business reasonableness (operations feasible in a real system and consistent with business rules), difficulty-label accuracy (actual complexity within one level of the label), naturalness of expression (close to real user language), and uniqueness (de-duplicated when semantic duplication with an existing task exceeds 80%). Three grades of disposition: pass and enter the pool; one or two dimensions below bar, return with revision notes for a timed fix; three or more below bar or business-unreasonable, return for redesign.
Test data must satisfy three properties: completeness — prerequisite data exist, related data are complete, and base data (accounts, customers, suppliers, materials, etc.) are ready; validity — business-object states match task intent, time-related data sit in the correct periods, and query result sets are reasonably sized; verifiability — expected results are definable, quantifiable, and decidable as right or wrong.
Beyond general inspection, all validation expected outputs in the enterprise management domain are manually confirmed for accuracy by Kingdee’s business expert team. The evaluation task set is frozen after review (version freeze); tasks inside a frozen version are never modified; unreasonable items found during evaluation runs go into a problem queue with a full audit trail, fixes are released in the next version with a complete re-run on the new version — results within any version are thus unaffected by the measured system’s outputs, and cross-version results are not directly compared (see Section 4.2 statistical reporting specification). Before formal release, the Lingee agent completes a full-set run first, supplemented by multi-baseline cross trial runs (model combinations of different capability tiers, rule systems, and human-expert spot checks): self-evaluation ensures that “is the task reasonable” is sensed before release rather than discovered by external users; multi-baselines distinguish “task defect” from “model failure” — a task that only a single system fails while humans and most baselines pass is judged a task defect first and enters the problem queue; task difficulty calibration also uses the multi-baseline convention (see Section 4.4), decoupling task-pool quality from any particular agent’s failure modes.
4Evaluation Protocol and Metrics
The evaluation protocol and metrics serve reproducible, comparable evaluation. This chapter rests on a basic recognition: the evaluation score is the joint product of four factor classes — model, Harness, environment, and evaluator — constrained by the protocol (task set, budgets, repeat-run counts, aggregation rules) [2]. Lingee Bench fixes each evaluated combination’s Harness, environment, and evaluator separately and discloses the protocol explicitly, so that scores are attributable to the evaluated combination itself.
4.1 Overall Framework Architecture
Figure 2 shows the overall architecture of the evaluation pipeline. Each task is submitted as a self-contained task directory; the execution layer runs the agent offline in a Docker environment with fully built-in dependencies; only after the agent run ends is the evaluation layer introduced — parser scripts extract facts from artifact logs and the final environment state, the rule-validation engine and the LLM Judge complete dual-channel scoring, and Task Scores aggregate by macro-average into domain scores and reports.
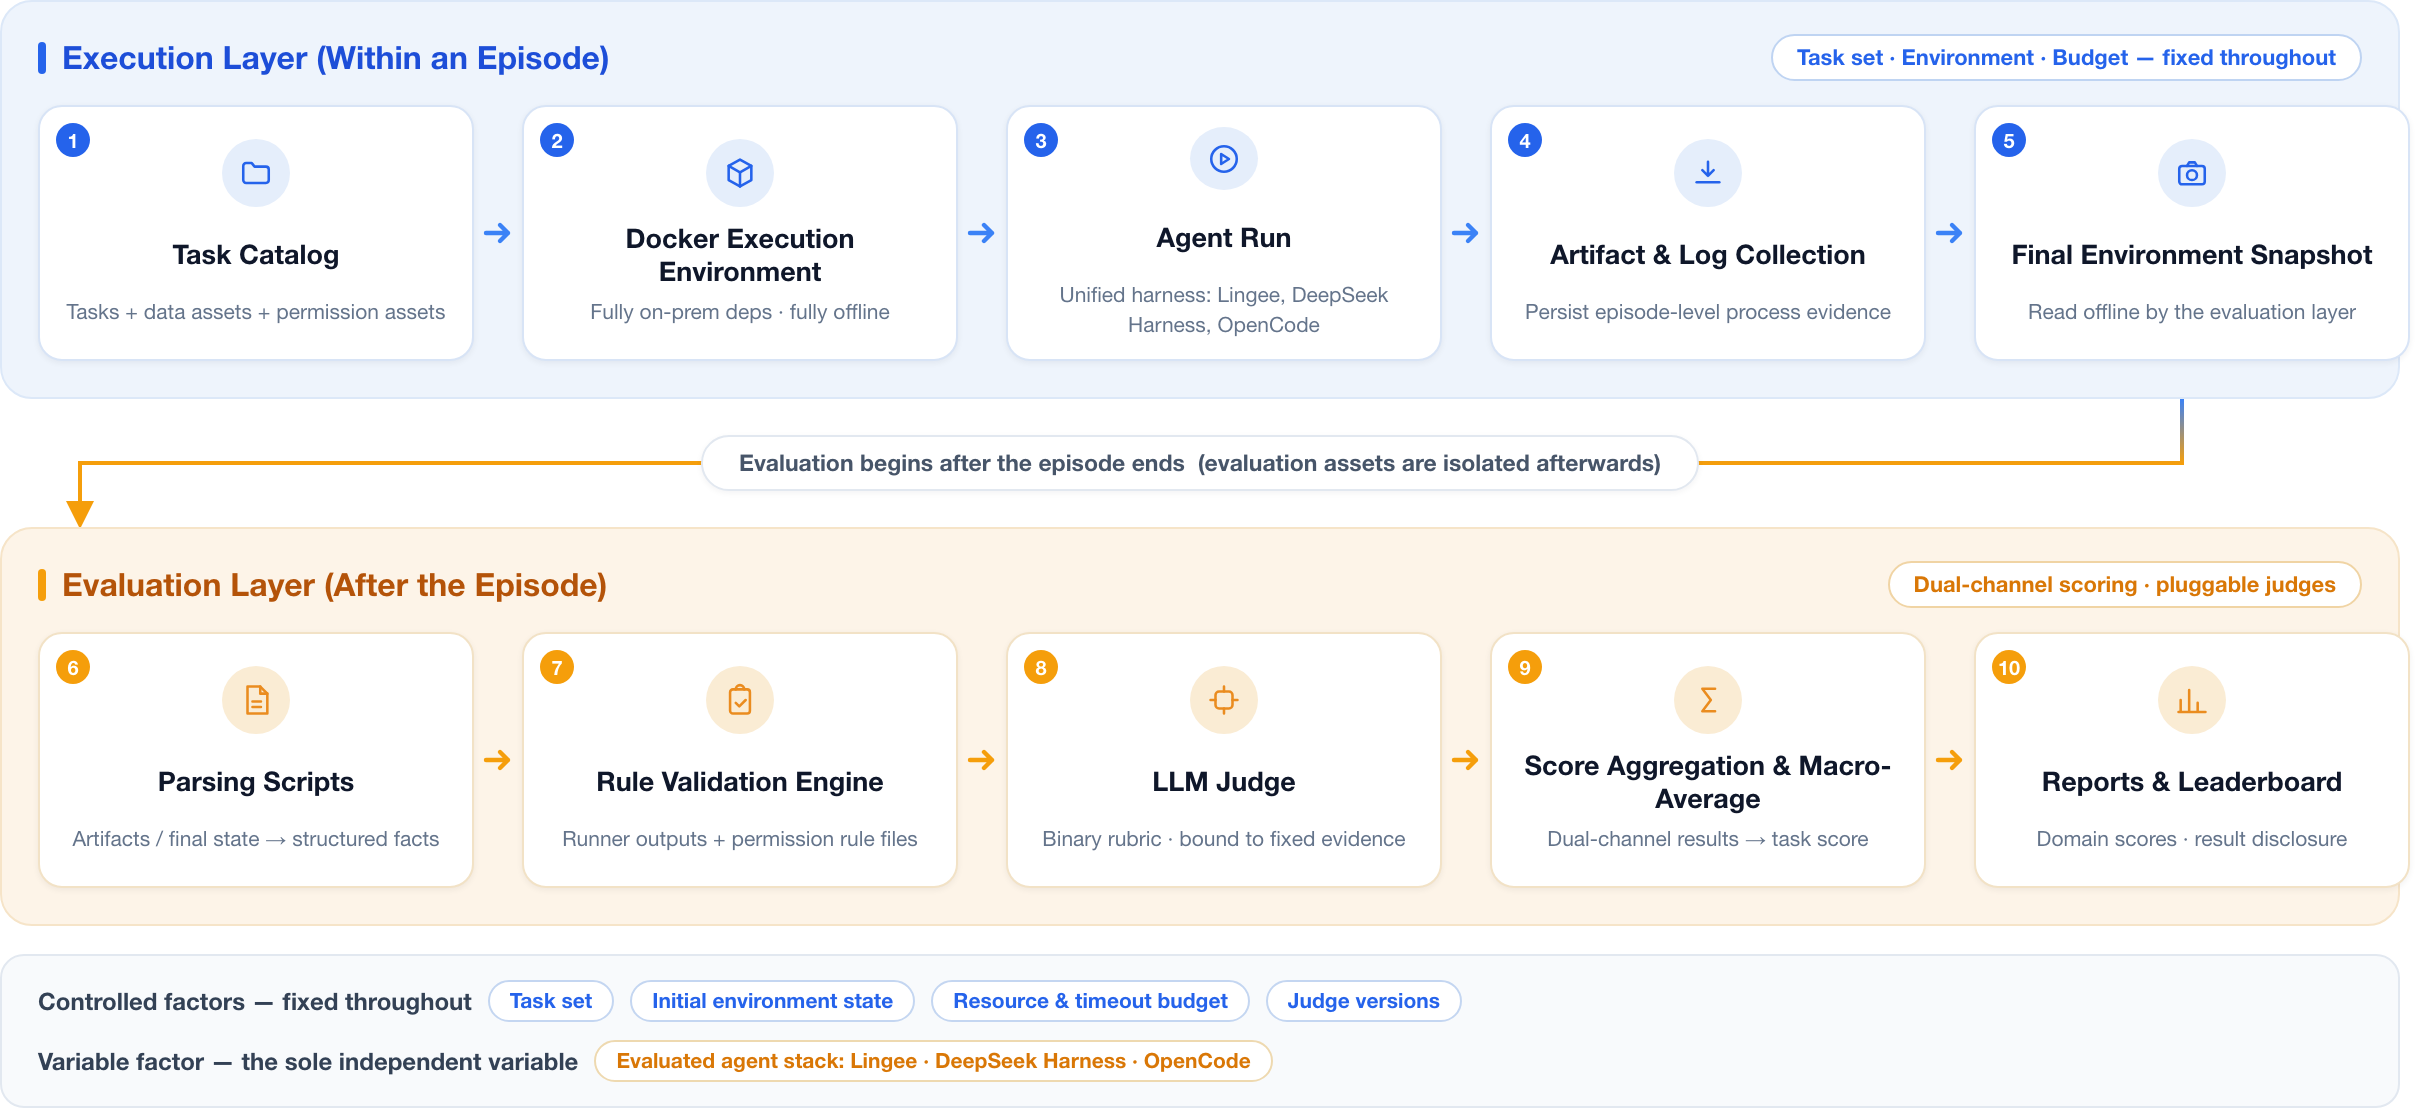
Figure 2 Overall architecture of the evaluation pipeline (execution and evaluation layers isolated by a deferred boundary)
The framework has three key points. First, uniform application across both domains: the general domain and the enterprise management domain share the same evaluation pipeline; differences appear only in the validation assets inside the task directory. Second, domain-pluggable scorers: how rule validation and the Judge combine is defined by each task’s validation assets; the pipeline itself is unaware of domain semantics. Third, the evaluation Harness is not an invisible background implementation but an explicitly fixed component of the evaluation disclosed with the results [9]: every link of the execution and evaluation layers (environment, budgets, parsing, validation, aggregation) has an explicit version and configuration (see Section 5.1), letting readers tell how much of a score comes from model capability and how much from the scaffold.
Controlled factors and the variable factor: the task set, initial environment state, resource and timeout budgets, and evaluator version stay fixed across all runs; the only independent variable is the evaluated agent combination (in the first round, the comparison across Lingee, DeepSeek Harness, OpenCode — three Harness implementations; see Section 5.1.1). This “controlled-factor table” design follows the standard practice of Harness-effect evaluation [9].
4.2 Metric System
Lingee Bench evaluates agents on three aspects: task-completion quality, token consumption, and run stability. Task-completion quality is the primary metric; token consumption and run stability are reported independently and not merged into a single score. The general and enterprise management domains share metric definitions and report domain scores separately; the enterprise management domain additionally reports finance, supply-chain, and manufacturing results, with no cross-domain total.
(1) Task-completion quality. The primary metric is the Task Score, ranging over [0,1], measuring how well an agent meets a task’s requirements in one run. The benchmark provides two scoring channels — deterministic rule validation and the LLM Judge — configured per the task’s acceptance requirements. Tasks that can be fully verified programmatically use deterministic rule scoring; tasks involving semantic quality requirements such as analytical grounding, completeness of explanation, or reasonableness of recommendations add the LLM Judge on top of rule validation. The scoring method and channel weights are fixed before evaluation; the computation is detailed in Section 4.3.
What the general domain grades is artifacts persisted to disk, not the execution process: each task defines an artifact contract — the file inventory and the required fields of structured summaries such as result.json — while tool-call chains are implementation details and not scoring objects. Rule validation covers four classes of objects: the artifact contract (files, fields, and table structure; multi-turn tasks persist per turn); numeric chains — recognition, computation, and cross-footing checked link by link, e.g., bill amounts recognized and the grand total equaling the sum of parts; format norms, e.g., invoice numbers in standard format with hyphens kept; and safety compliance, e.g., zero tolerance for banned words and web links. Numbers are checked under equivalence: a numeric cell and a thousands-separated string count as the same amount. Core numeric errors (e.g., a wrong amount on any bill) are fatal items that zero the entire run.
Semantic quality is rated by the LLM Judge on graded-level scoring items; typical general-domain items include whether remediation advice targets the main driver accounts and provides calculated figures, whether source annotations of knowledge-base answers really exist and point correctly (citation grounding), and whether functions or parameters absent from the knowledge base are fabricated. Scoring channels and weights are declared per task and frozen with the task freeze (see the score-composition entries of the cards in Section 2.4.3).
In the enterprise management domain, rule validation covers business results and their constraints. For example, finance tasks check amounts, accounting periods, debit-credit balance, and voucher status; supply-chain tasks check order-to-goods-document linkage, quantity consistency, and inventory changes; manufacturing tasks check BOM relations, production-plan constraints, and work-order status. Complementing these is another class of semantic quality requirements, such as whether anomaly analysis is supported by evidence, whether business recommendations respect known constraints, and whether the report fully states unresolved problems. Such requirements cannot be fully expressed by deterministic rules and are evaluated by the Judge. Rule scores and Judge scores are kept separate, distinguishing objective result errors from insufficient semantic quality.
The Task Score allows partial completion to earn the corresponding credit. Every task declares in advance a core delivery threshold and fatal items: if a core deliverable is missing or unparseable such that the task as a whole cannot be accepted, or if any fatal item fails, that task run scores 0. Other missing deliverables, content errors, or quality shortfalls score through the corresponding scoring items.
For tasks with independently scored modules, a missing or unacceptable module scores 0 while other modules score normally; only when a pre-declared task-level zeroing condition triggers does the whole task go to zero. Module division, scoring items, and weights are fixed before evaluation; missing modules stay in the scoring scope, and their weights are not redistributed.
Each task is run multiple independent times: valid run scores are averaged within the task first, then an equal-weight macro-average is taken across tasks in the domain, so that tasks with more checks or more runs do not gain extra weight. Let T be the set of domain tasks in the aggregation, A_t the set of valid runs of task t, and S_{t,a} the score of a single run; then:
S̄_t = (1/|A_t|) · Σ_{a∈A_t} S_{t,a}
TaskScore(T) = (1/|T|) · Σ_{t∈T} S̄_t
Rule and Judge scores use the same two-level aggregation, with Judge scores aggregated only over tasks where the channel is enabled by design, and the coverage disclosed. Runs where the agent fails through reasoning or operation errors, exhausting the execution budget, or not completing the task still count as valid runs; technical evaluation exceptions are handled per Section 4.3. Formal results must complete all prescribed tasks and valid run counts; when not yet complete, the numbers of valid tasks and runs and the evaluation coverage must be disclosed and the run marked as an incomplete evaluation.
(2) Token consumption. Token consumption describes the model-invocation overhead while the agent executes tasks. Enterprise-management tasks such as financial reconciliation, supply-chain analysis, and manufacturing anomaly investigation usually involve multiple rounds of information reading, business judgment, and result verification. Differences in context organization, task decomposition, and retry strategy can make agents consume different numbers of tokens at similar completion quality. This benchmark therefore reports token consumption as a resource-usage metric alongside task-completion quality.
The benchmark counts input tokens, output tokens, and totals over the full course of a task run and reports per-task averages by domain. The count covers all model invocations during execution; the exact counting conventions are disclosed with the evaluation configuration. Input tokens are counted cache-inclusive (including cache reads); different models use different tokenizers, so a token is not a constant unit of work across models — efficiency numbers are to be read only within explicit conventions, without strict cross-model efficiency rankings. Under the same model, task set, and evaluation conditions, token consumption is analyzed together with Task Score and success rate to examine the trade-off between completion quality and resource usage across execution strategies. At similar completion quality and success rate, lower token consumption reflects higher resource efficiency. The benchmark also records each task’s end-to-end duration and interaction turns, reported alongside token consumption as efficiency metrics: producing text fast is not delivering business results fast; duration and turns complement the picture from the angles of delivery timeliness and interaction cost.
(3) Run stability. Stability uses the all-k-pass rate (reliability@k), measuring the proportion of k independent runs of the same task that all succeed; it is the opposite sense of pass@k, which measures “at least one success,” and this paper does not use the latter [10]. The Task Score measures degree of completion; binary success judgment (each run recorded only as success or failure) measures the ability to fully complete: a run counts as success when the core delivery threshold and fatal items pass, all ordinary rule items pass, and all Judge scoring items enabled by the task configuration pass; otherwise it fails. Rule-only tasks judge success by the core delivery threshold, fatal items, and rule items. A run missing a required module can earn partial task score but is not a full success.
Let each task run n valid independent times, with task t succeeding c_t times; for k ≤ n, we use:
reliability@k = (1/|T|) · Σ_{t∈T} C(c_t, k) / C(n, k)
where a task contributes 0 when c_t < k. reliability@1 is the single-run success rate; larger k put more weight on completing tasks consistently and reliably. The metric is computed after each task completes its prescribed number of valid independent runs.
Repeat runs must restore the same initial environment, with task, budgets, tools, and scorer configuration fixed; artifacts or memory from the previous run are not inherited, and independent runs use different random seeds. Retries used to recover from technical evaluation exceptions do not count as additional independent runs in stability statistics. Reports must disclose the repeat count, confidence intervals for binomial proportions, and result uncertainty, judging whether score gaps are stable in light of repeat-evaluation fluctuation. Auxiliary analyses report failure-type distributions, distinguishing missing deliverables, numeric or state errors, business-constraint violations, insufficient semantic quality, and exhausted execution budgets.
Beyond the macro-average, the enterprise management domain also reports four business-view metrics: risk-weighted score — weighted by each task’s business risk level, with tasks involving high-risk operations such as fund receipt and payment, voucher posting, and document activation up-weighted, the weights declared and frozen with the scoring assets before evaluation; end-to-end success rate of key processes — the full-chain pass proportion of complete business-chain tasks such as voucher entry → review → posting → closing; fatal-error rate — the share of runs triggering fatal items, directly corresponding to the business bottom line; and functional-boundary correctness — the proportion of unsupported or unauthorized requests correctly refused with guidance. The macro-average answers overall completion; the four metrics answer whether risk and bottom lines hold.
Statistics and baseline design. Result interpretation is equipped with three classes of reference baselines, all plugged into the same evaluation pipeline and scoring assets as the systems under evaluation, with only the executor swapped. Human-expert baseline: business experts complete stratified-sampled tasks directly in the evaluation environment, with completion rate and time reported as an upper-bound reference. Simple baselines measure completion without agent orchestration, built from per-type templates rather than per-task development, in two forms: a single-turn direct-call baseline — the same model answering once without multi-turn loops, memory, or planning, separating base model capability from orchestration gains; and a rule-script baseline — deterministic scripts for patternable query and single-step operation tasks (statement parsing → fixed tool-call sequence, no LLM involved), measuring how far tasks can be solved programmatically. Random baseline: random tool calls or random content within the legal action space; its expected score is a lower-bound reference and doubles as a scorer soundness check — an anomalous score for random artifacts on a task signals a hole in that task’s validation rules.
4.3 Scoring Mechanism
Lingee Bench uses a post-hoc scoring framework based on deterministic rule validation, with the LLM Judge introduced as tasks require. During execution the agent accesses only the task instructions and the permitted workspace; after the run ends, the pipeline saves final artifacts, the final environment state, and execution logs, then brings in expected outputs, validation rules, and the Judge scoring assets enabled by the task configuration. With dual-channel scoring, the two channels produce and keep their results separately; the Judge does not rewrite recorded rule-validation conclusions. The scoring design follows public practice in agent-evaluation methodology — judging by final environment state and artifacts, combining rules with model judges, and using repeated runs for reliability [11].
Task scoring measures the degree of business-goal attainment and delivery quality; token consumption is an independent resource metric reported alongside.
(1) Deterministic rule validation. Each task predefines business expected results, a core delivery threshold, and validation items. In the enterprise management domain, expected results are confirmed item by item by business experts; tasks with multiple reasonable answers must specify the acceptable answer set, numeric range, or equivalence conditions. Precision, tolerances, and multi-answer handling follow the unified norms of Section 2.5.3 (Tables 6 and 7).
Parser scripts extract facts from final artifacts, the final environment state, and execution logs, then verify item by item. Validation targets include file and field structure, numbers and formulas, business state, cross-file or cross-document relations, side effects, and execution boundaries. An agent declaring “operation succeeded” in its final reply cannot substitute for objective evidence: a voucher-review task must check actual voucher status; a goods-issue task must check the issue document and inventory changes; a production task must check work orders and related business records.
The core delivery threshold judges whether a task’s result has an acceptance basis at all. File-generation tasks check that core artifacts exist at the declared path and parse; system-operation tasks check that the target business state can be read and verified; query and analysis tasks check that verifiable answers are provided in the prescribed carrier. The threshold covers only results necessary for the task to stand; other missing deliverables or content errors are evaluated through their scoring items rather than uniformly zeroing the task.
Validation items divide into fatal and ordinary. Fatal items express unacceptable business errors — for example, an unbalanced voucher saved as a valid result, unauthorized modification of business data, or side effects the task explicitly forbids. If any fatal item fails, that run’s score goes directly to zero. Fatal items are recorded separately and stay out of the denominator of ordinary rule scores.
Deterministic rule scoring uses, per the task’s acceptance requirements, either all-or-nothing judgment or itemized scoring. Tasks using all-or-nothing judgment earn rule score 1 only when all prescribed checks pass, else 0. Tasks using itemized scoring measure partial completion through ordinary rule items, each returning pass or fail. Let task t have N_t ordinary rule items with results c_{t,a,i} ∈ {0,1}; the rule score is:
R_{t,a} = (1/N_t) · Σ_{i=1}^{N_t} c_{t,a,i}
Ordinary rule items in itemized scoring count equally, and every task sets at least one. Check items should correspond to independent, interpretable requirements, avoiding splitting one requirement into many duplicate checks that distort its effective weight.
Tasks with independently scored modules must specify the scoring items of each module. For a missing or unacceptable module, its rule items score 0 and stay in the denominator; other modules keep scoring per the preset rules.
The execution process is validated only when the task explicitly requires operation order, authorization, or necessary preconditions — for example, completing the prescribed state handling before modifying a reviewed voucher. Multiple legal execution paths must all be accepted; the agent is not required to reproduce the reference solution’s full tool-call sequence.
(2) LLM Judge scoring. The Judge channel evaluates semantic quality that deterministic rules can hardly express. Whether the channel is enabled is decided by the task’s acceptance requirements and declared in the scoring configuration. Each scoring item defines exactly one quality condition, rated on graded levels: the level set, per-level criteria, and designated evidence are declared item by item; the minimum is two levels (pass/fail), with more levels (e.g., a 0–4 five-level scale) when semantic quality needs finer discrimination. For example, “anomaly attribution is supported by source data,” “payment recommendations respect the given funding constraints,” “the production-plan note lists unresolved capacity conflicts.” Scoring conditions must be independently decidable from evidence, avoiding vague descriptions like “generally good.”
The Judge receives only the task instructions, the rule-validation results, and the fixed evidence designated by the current scoring item. Evidence is produced by the post-hoc parsing flow and may include artifact text, tabular data and formulas, rendered pages, business-state summaries, or necessary execution records. The Judge does not access the running workspace, does not supplement external facts on its own, and does not treat self-claims lacking evidence in the artifacts as grounds for business correctness.
Let task t have K_t semantic scoring items; item j is rated on graded levels, with the obtained level g_j and the maximum level G_j, and the normalized level value b_{t,a,j} = g_j / G_j ∈ [0,1] (for pass/fail two-level items, pass counts 1 and fail 0); the Judge score is:
J_{t,a} = (1/K_t) · Σ_{j=1}^{K_t} b_{t,a,j}
Each verdict must return the scoring-item identifier, the obtained level, evidence references, and a brief rationale. If the artifacts lack the required evidence, or the conclusion cannot be supported by the designated evidence, the item scores the lowest level. For independently scored modules, Judge items of missing or unacceptable modules score 0 while other items evaluate normally; the scoring scope and denominator are not adjusted for missing modules.
Scoring items and reference evidence are human-reviewed and frozen before evaluation; all evaluated configurations use the same version, and standards are never adjusted based on some agent’s output.
(3) Scoring method and composition. Every task declares in its scoring configuration whether it uses rule-only or dual-channel scoring. Rule-only tasks take the rule score directly as the Task Score once the core delivery threshold and fatal items pass. Dual-channel tasks set separate weights for the rule score and the Judge score according to the relative importance of objective results and semantic quality in task acceptance, the two summing to 1.
Different tasks may use different weights, with no unified rule-weight range. Scoring methods, items, and weights are reviewed, written into the task’s scoring assets, and frozen before evaluation. The same task uses the same scoring rules for all evaluated configurations, unadjusted by model, execution strategy, or run outcome.
Let D_{t,a} indicate whether the task-level core delivery threshold passes, and F_{t,a} whether all fatal items pass; F_{t,a} = 1 when there are none. Let w_t be the rule weight of a dual-channel task. For runs that yield a valid scoring result, the single-run Task Score is:
S_{t,a} = 0,                                 if D_{t,a} = 0 or F_{t,a} = 0
S_{t,a} = R_{t,a},                           if D_{t,a} = F_{t,a} = 1 (rule-only scoring)
S_{t,a} = w_t·R_{t,a} + (1 − w_t)·J_{t,a},   if D_{t,a} = F_{t,a} = 1 (dual-channel scoring)
Actual execution of the scoring channels must match the task’s declaration. The weighted composition of dual-channel tasks presumes the required Judge result is valid; a temporary invocation failure does not permit falling back to rule-only scoring. Whatever the final score, available rule results, Judge results, and failure reasons are retained to support error diagnosis and audit. Task and domain scores aggregate per the two-level scheme of Section 4.2.
(4) Exception handling and quality verification. The framework handles technical exceptions during execution and scoring under preset policies; all evaluated configurations use a consistent retry policy, recording exception causes, retry counts, and final states. Retries in the scoring stage work on the artifacts and final environment state saved from the same run.
Runs where environment startup, communication, evidence-extraction, or scoring-service exceptions caused by the evaluation infrastructure still fail to yield a valid evaluation result after retries are marked as evaluation-incomplete, the corresponding task scores are marked unavailable, and the cause and evaluation coverage are disclosed. Obtained artifacts, logs, and partial scoring results are retained for fault analysis and audit.
Runs where the agent fails in a valid evaluation environment through reasoning or operation errors, task incompletion, or budget exhaustion are scored on the artifacts and final environment state at stop and count in task-completion quality and run-stability statistics. Artifacts that are themselves unparseable or lack the task-required evidence are handled under the core delivery threshold and the corresponding scoring items.
Tasks with the LLM Judge enabled must carry out scoring-quality verification, including human agreement, repeated-verdict stability, and checks for position bias, length bias, and same-origin model preference on applicable items. When multi-Judge majority voting is used, the number of Judges, model versions, voting rules, and disagreement handling must be fixed before evaluation. Judge models, prompts, evidence-extraction procedures, and scoring-asset versions are disclosed with the results; sampling sizes, agreement rates, and bias metrics of the verification experiments are reported once the experiments complete.
Judge quality verification. To quantify the trustworthiness of the Judge channel, the benchmark designed five verification experiments: (1) human agreement — task artifacts are sampled from both domains, annotators judge level by level independently under the same rubric, the Judge–human agreement rate is reported, and an acceptance threshold is set with reference to the 90% agreement level of prior work; (2) position bias — for pairwise-comparison items, re-judge after swapping presentation order and measure the verdict-flip rate; (3) length bias — construct output pairs of similar semantic quality but different length, and test whether the Judge systematically prefers longer outputs; (4) self-preference — compare agreement-rate differences between same-origin and cross-origin settings of Judge model and evaluated model; (5) repeat stability — judge the same evidence repeatedly at nonzero temperature, reporting the single-shot flip rate and majority-vote convergence.
Scoring auditability is guaranteed by normative assets: the weight and scoring-item configuration table (channel choices and weights declared in each task’s scoring assets, frozen before evaluation); the fatal-item catalog (the category list of fatal checks — unbalanced vouchers, unauthorized and destructive operations, etc. — maintained and publicized by version); the evidence-format specification (field and source definitions of the fixed evidence bound to Judge items); Judge prompt templates and model versions; and a human arbitration mechanism — disputed Judge verdicts are arbitrated by business experts and used to calibrate rubrics. When any bias metric of the Judge verification experiments exceeds the invalidation threshold, that batch of Judge results is downgraded to reference status and recalibration is triggered. These assets are consolidated into the Scoring Specification document; its release scope is in Appendix C.
The concrete composition of these assets is represented by the scoring assets of the six sample tasks. Weight and scoring-item configuration table — each task declares its scoring mode (dual-channel or rule-only) and the rule-channel weight; the six tasks’ weights lie in 0.3–0.7, set per task by the decidability of the scoring target with no unified range, and frozen with the task freeze before evaluation. The rule channel’s numeric verification executes the public result-table contract on business-expert-confirmed expected values: reading only result tables with the specified table and column names, missing values not counted as zero, one row per business key, and consistency across artifacts. Fatal-item catalog — zeroing a whole task is limited to fatal criteria explicitly declared in the scoring assets (e.g., a key amount misrecognized); undeclared criteria score in their own channel at their own level. Evidence-format specification — the fixed evidence bound to Judge items is expressed as “source + location + original text” triples; the evidence list, excerpts, and their mapping to scoring items are frozen before evaluation, and the Judge does not access the workspace at rating time. Judge prompt templates — criteria are judged independently item by item, only per the level scale declared in the task, without recomputing numeric ground truth; each verdict must cite the given evidence number with a rationale, output structured results covering all criteria completely, and an inability to reach a legal verdict counts as an evaluation fault, not a candidate zero.
Judge scoring items (rubrics) are designed per task type and uniformly rated on graded levels: document and knowledge-retrieval types bind source evidence and rate citation grounding, key-point coverage, and no fabrication; analysis-report types rate topic coverage and substantive analysis (merely listing components does not pass); interactive-delivery types rate by graded levels on displayable charts, card layout, drawer navigation, and similar elements. The number and granularity of scoring items are declared per task; the six sample tasks have 3–16 content criteria. The weight w is the rule-channel weight, declared per task and frozen with the freeze, with no unified range: tasks whose numeric and structural contracts can be checked exactly have higher w (up to 0.7 in the samples), and semantics-heavy tasks lower w (down to 0.3). The Judge prompt conventions and the full set of scoring items are released with the Scoring Specification.
Take the enterprise-management-domain task “Two-Day Process Quality Comparison” as an example (statement in Section 2.5.4, Example 3; deep dive in Section 5.2, Task 6): the task uses dual-channel scoring with rule weight 0.4; content quality is evaluated by 4 criteria, each rated on the 0–4 five-level scale, with each criterion declaring what it examines and binding fixed evidence. Table 9 excerpts two criteria’s descriptions and level definitions.
Table 9 Judge content-criteria examples for the manufacturing quality-inspection task (excerpt)
| Scoring item | Criterion description (excerpt) | Level definitions (excerpt) |
|---|---|---|
| Two-day metric comparison | Present the two days’ first-inspection pass rate, patrol anomaly rate, patrol counts, and other metrics in the agreed overall metrics table, with clear direction of change and units and a clear split between formal and supplementary conventions; numeric ground truth is verified independently by the rule channel, so this item rates only delivery coverage and expression and does not double-penalize numeric errors. | 0 = no recognizable metric results at all; 1 = only isolated single metrics for individual days, with no two-day comparison; 2 = a two-day comparison exists, but not in the agreed overall metrics table, or only one of the two rates is presented; 3 = both two-day rates are in the agreed table, but patrol record or anomaly counts, direction of change and units, or type/convention distinctions are still incomplete; 4 = the agreed table covers both two-day rates and both patrol counts, with clear direction of change and units and convention distinctions matching the published format. |
| Quality-change interpretation | Explain the changes in first inspection, patrol inspection, and defect structure; judge with the total patrol record count whether anomaly count and anomaly rate move in the same direction, and explain the difference between counts and proportions; distinguish directly observed results from causes yet to be verified, and do not declare overall quality improved merely because individual metrics improved. | 0 = no interpretation of change; 1 = only blanket assertions such as quality got better or worse, with no data linkage; 2 = some trend explanation, but not covering first inspection, patrol inspection, and defects, or not discussing the direction and denominator of anomaly count vs. rate; 3 = all three aspects and the anomaly count and rate are explained, but the relation between counts and proportions or patrol record counts is unclear, or unverified causes are stated as proven facts; 4 = interpretations of all three aspects match the shown results, the count–proportion distinction is clear, and direct phenomena and unverified causes are clearly separated. |
The task’s rule channel verifies the result-table numbers under the public result-table contract and composes the Task Score with the above content criteria at weights 0.4/0.6; the full scoring composition is in Section 5.2, Task 6.
Separation of scoring model and execution model: the LLM Judge uses a stronger model as the scoring model, while the evaluated combinations use a more basic, more cost-effective model as the execution model, reducing same-origin self-preference at the source (the corresponding verification is experiment 4 of the five in this section). In the first evaluation round, the scoring model is GLM-5.3 and the execution model is GLM-5.3-Flash; full version numbers and inference parameters will be disclosed with the Scoring Specification.
4.4 Contamination Prevention through Identically Distributed Public and Held-Out Groups
Contamination prevention starts with construction: tasks are reconstructed and synthesized from scenarios and public materials, no public task statement is copied, and statement text cannot be hit by web search — the searchable-statement path is closed the moment a task is written. All evaluation task-set data is synthesized from public materials (see Section 3.1).
On top of constructive prevention, the benchmark turns contamination into a continuously measurable signal with its identically distributed public/held-out dual-group design. The benchmark consists of a publicly released part and an unreleased retained part, identically distributed across scenario category, operation type, and difficulty tier. Concretely: the first batch of 65 tasks is open-sourced, downloadable by anyone and reproducible offline in a local Docker environment; the remaining 1,335 tasks are retained and evaluated through the official Lingee Bench website.
Identical distribution is guaranteed by an auditable three-step construction process. Step one, build task difficulty profiles: from pre-release multi-baseline trial-run data — jointly formed by multiple model combinations of different capability tiers, rule baselines, and human expert calibration, so that task difficulty is never defined by a single evaluated system’s performance, with run count K and the baseline list disclosed at release — draw a top-k pass curve for every task, tabulating its pass rate over k independent runs (k = 1, 2, …, K) and its variation to characterize difficulty level and score stability; curve features together with metadata such as scenario category, operation type, difficulty tier, and business module form the task’s difficulty feature vector. Step two, matching-distance computation: in the difficulty feature space, nearest-neighbor matching under the Propensity Score Matching (PSM) framework computes the matching distance between tasks and identifies the most similar task pairs — the smaller the distance, the closer the two tasks’ difficulty features for the same evaluated combination. Step three, stratified sampling: with scenario category, operation type, and difficulty tier as the primary strata, tasks are allocated between the two groups by matching distance, so that every public-group task has its nearest held-out counterpart; the two groups thus agree not only in stratum proportions but also in the overall distribution of task-level difficulty profiles.
How the design works: identically distributed groups imply the same capability expectation for the same model. If public-group scores rise markedly as models and training data iterate while the held-out group does not move, the widening gap (public − held-out) is an estimate of the memorization effect — an early-warning signal of contamination, not a verdict of it: before reading the gap, alternative explanations must be excluded — sampling error (the gap’s confidence interval), task-version changes (the two groups must be compared on the same version snapshot), and task heterogeneity. The held-out group’s score always represents the model’s true generalization on unseen tasks, giving evaluation conclusions a calibration reading unaffected by benchmark-targeted optimization.
This structure also resolves the inherent dilemma of benchmark design: a fully public benchmark is reproducible but contamination-prone (OpenAI’s abandonment of SWE-bench Verified over saturation and contamination is a case in point), while a fully secret benchmark resists contamination but cannot be reproduced by third parties. This benchmark decouples the two goals — the public group carries reproducibility, reproducible offline by anyone; the held-out group carries credibility, usable for calibration at any time. Moreover, the two identically distributed groups are a control platform for the pipeline itself: when pipeline components such as parser scripts or Judge prompts iterate, consistency between the groups’ conclusions is verified first, preventing evaluator drift from being misread as a change in the measured system.
A boundary to state: the held-out group also leaks; the rotation mechanism mitigates but does not eliminate. Leakage has at least three realistic channels. First, distribution spillover: identical distribution is the premise of the dual-group design, but it also means the 65 public tasks fully expose the benchmark’s statement style, scenario composition, data shapes, and difficulty profile — gains from optimizing against the public group spill over partly to the identically distributed held-out group. Second, the evaluation side channel: the held-out group is evaluated via the official website, and repeated submissions with score feedback themselves form a detectable signal source, leaving room to overfit hidden tasks through repeated submissions — a phenomenon with precedents on public leaderboards with hidden test sets. Third, shared construction origin: held-out tasks, like public ones, are synthesized from public materials and real business scenarios; the statements, though reconstructed and unsearchable, have blueprints (report structures, business processes, product knowledge) that already sit in training corpora, and model familiarity with the blueprints naturally narrows the gap between the groups; add the many people involved in construction and review, and the chance of statement fragments slipping into public corpora via conversation logs or internal documents cannot be zeroed out. This benchmark therefore claims no absolute freedom from contamination; it treats contamination as an engineering problem under continuous management: the dual-group design makes it measurable, gap monitoring makes it alertable, and version rotation makes it governable; the operating mechanisms of continuous updates, version rotation, and submission governance are in Chapter 7.
5Evaluation Runs and Task-Level Deep Dives
This chapter describes the evaluation-run setup and how results are presented. The first evaluation round completed a controlled comparison across Lingee, DeepSeek Harness, OpenCode — three Harness implementations — on the public group (the first batch of 65 open-sourced tasks) ; in this white paper, six representative tasks are drawn from the public group for task-by-task deep analysis, using concrete cases to show how the evaluation system works and how results should be read. The applicability limits of this chapter's results — result attribution, comparison conventions, convention separation, and extrapolation boundaries — are stated uniformly in Section 5.3; readers are advised to read that section before citing any number in this chapter.
5.1 Evaluation Setup
5.1.1 Systems Under Evaluation and Evaluation Format
The systems under evaluation in this benchmark are “combinations of Harness and model” (hereafter “evaluated combinations”). The first round selects three Harness for a controlled comparison: Lingee, DeepSeek Harness and OpenCode (opencode), run on exactly the same tasks, initial environments, budgets, and scoring assets, to observe how execution-scaffold differences affect task completion. To be clear first: this benchmark is positioned as a versioned, reproducible, enterprise-grade evaluation suite, not a multi-model leaderboard; the three combinations’ model and version configurations are recorded item by item and published with the seven-layer disclosure checklist (see Section 5.1.2), and results are interpreted as each evaluated combination’s performance on these evaluation assets, not as an independent evaluation of any model or any Harness.
The evaluation uses the locked-harness (locked-scaffold) format. This choice is not a compromise on coverage but a methodological requirement from Harness-effect research on evaluation credibility. Controlled-factor experiments show: on the same task set, swapping the execution scaffold (Harness) can move an agent’s score by 8.5–13 percentage points, while swapping the base model moves it only 2.5–5 points; in 9 paired experiments, 6 saw ranking flips, and the score variance induced by the Harness can reach 7.8 times the model variance [5]. Cross-benchmark observations further show that for the same model, swapping only the Harness can produce a maximum gap of 53 percentage points [12][13]. This means that if an evaluation does not lock and disclose the Harness configuration, scaffold gains are easily misattributed to model progress, and cross-leaderboard, cross-version score comparison loses attributability.
Lingee Bench therefore makes the Harness an explicitly fixed, fully disclosed component of the evaluation framework rather than an invisible backend implementation. The three evaluated combinations each run under controlled and fully disclosed Harness configurations, with the task set, initial environment state, resource and timeout budgets, and evaluator version fixed across all runs of all combinations; the only independent variable is the evaluated agent combination. This “controlled-factor table” design follows the standard practice of Harness-effect evaluation [9], making within-combination comparisons consistent and every score’s attribution combination (Agent × Harness × environment × evaluator) transparently checkable.
5.1.2 Seven-Layer Configuration Disclosure Checklist
The evaluation setup is organized as a seven-layer disclosure checklist (HarnessCard), one filed per evaluated Harness : Lingee’s filing is Table 10; the HarnessCards of DeepSeek Harness and OpenCode will be published with the release version once the evaluation configuration is finalized. The checklist covers the complete configuration chain from execution environment to governance boundary, ensuring third parties can understand, audit, and — where conditions allow — reproduce the evaluation run conditions. The HarnessCard, together with budget configuration, the human-assistance rules of clarification interaction, the environment snapshot version, and run dates, forms each evaluated combination’s unified result card, released with the results.
Table 10 Evaluation configuration disclosure checklist (seven layers)
| Layer | Disclosed items | First-round configuration highlights (Lingee HarnessCard) |
|---|---|---|
| Execution | Runtime, sandbox, file and network access, task timeout, step timeout, max steps | Fully self-contained offline Docker sandbox; no external network access; task-level timeout and step budgets configured per task and disclosed with results |
| Tool | Tool inventory, schema style, error formats, retryable error classes | Unified tool interfaces and schema style; standardized error formats; retryable error classes declared up front |
| Context | Window limit, context ordering and compression policy, persistent memory | Fixed context-window limit; versioned ordering and compression policies; persistent-memory policy explicitly declared |
| Scheduling | Agent loop, stopping rules, retries, escalation and rollback | Agent loop and stopping rules locked; unified retry and escalation policies; rollback mechanism in place |
| Observability | Trajectory format, checkpoints, log auditability | Full-trajectory logging; checkpoint mechanism; standardized log format and audit interfaces |
| Verification | Output parsing, validation, self-checks, anomaly detection | Versioned parser scripts; frozen validation rules and Judge configuration; anomaly-detection mechanism in place |
| Governance | Permission model, allow/deny lists, side-effect boundaries, human approval points | Locked permission model; explicit allow/deny lists; declared side-effect boundaries; human approval points configured per task |
The seven-layer disclosure matters because it lifts evaluation configuration from “invisible implementation detail” to “auditable component of the evaluation.” Readers can judge how much of a score comes from model capability and how much from scaffold and configuration choices; third parties can reproduce run conditions under the same configuration, or run controlled comparisons with configuration differences made explicit. This disclosure standard directly answers the new requirements on evaluation credibility raised by Harness-effect research [5][2].
5.1.3 Configuration Records and Version Management
Beyond the seven-layer checklist, inference and run configurations are recorded item by item and released with the results, including: model and agent versions, temperature, top-p, max output tokens, context window and compression threshold, reasoning mode, per-task independent run count, and the version numbers of every pipeline component. The purpose is to make every score traceable to the exact run conditions, avoiding the attribution difficulty of “black-box evaluation.” The records of the three evaluated combinations — Lingee, DeepSeek Harness, OpenCode — are retained separately and released with the results. Configuration records and result cards are one: any published score can be traced back to the full configuration combination and run date that produced it.
Version management follows freeze-and-rotate principles: the evaluation task set is frozen after review (version freeze); tasks inside a frozen version are never modified; unreasonable items found during runs go into a problem queue with a full audit trail, fixes are released in the next version with a complete re-run on the new version. Results within any version are thus unaffected by the measured system’s outputs, and cross-version results are not directly compared (see Section 4.2 statistical reporting specification and Section 3.3 quality assurance system).
5.1.4 Evaluation Environment and Execution Protocol
The evaluation environment and execution protocol are as in Section 3.2: fully self-contained Docker images, offline execution, final-state scoring, data independence, and budget control; the evaluated combinations’ budgets and environment configurations are disclosed with the unified result card (see Section 5.1.2), and capability boundaries and extrapolation limits follow the unified statements of Sections 3.2 and 5.3.
5.1.5 Clarification Interaction Protocol
The clarification interaction protocol is as in Section 3.2 — the simulated user answers only the task’s pre-planted clarifiable items, clarification requests have a waiting cap, non-critical defaults may be executed under declared assumptions, and key business parameters must be clarified, with scoring treating clarification and direct execution equally; the unified simulated user and response scripts ensure all evaluated combinations face the same ambiguous requests, so path choice rests on capability judgment rather than environment-rule differences. Protocol details and a response-script example are in Section 3.2.
5.1.6 Separation of Feedback and Measurement
Separation of feedback and measurement follows Section 3.2: Harness and prompt tuning happen only on a separate development subset, and the evaluation set stays held-out [8]. In the first round, each task runs multiple independent times, reporting means and reliability@k; the independence requirements for repeated runs and the rules for counting retries follow the statistical conventions of Section 4.2.
5.2 Task Deep-Dive Analysis
The six tasks comprise 3 from the general domain and 3 from the enterprise management domain — one each from finance, supply chain, and manufacturing. Selection principles: the three general-domain tasks cover different capability categories and task forms, all scored by the rule + Judge dual channel — Batch Recognition and Posting of Multiple Invoices (Image Processing), Cost Overrun Attribution Drill-Down (Data Analysis), and Refund Reversal Chain Tracing (Knowledge Base Retrieval), with task cards in Section 2.4.3; the three enterprise-domain tasks belong to different business modules and together cover multiple operation types among query, operation, analysis, and document processing — December Business Analysis Report (Finance), January Sales Monthly Report (Supply Chain), and Two-Day Process Quality Comparison (Manufacturing), with task cards in Section 2.5.4. The six tasks overall span at least two difficulty tiers. Selection balances typicality and diversity but constitutes no statistical sample; case conclusions are not extrapolated to overall performance. The composition framework is Table 11.
Table 11 Composition framework of the six-task deep dives
| Domain | Count | Coverage requirements |
|---|---|---|
| General domain | 3 | Covers different capability categories and task forms; all scored by the rule + Judge dual channel |
| Enterprise Management · Finance | 1 | Covers typical operation types of the finance module; difficulty complements the other two dimensions |
| Enterprise Management · Supply Chain | 1 | Covers typical operation types of the supply-chain module; difficulty complements the other two dimensions |
| Enterprise Management · Manufacturing | 1 | Covers typical operation types of the manufacturing module; difficulty complements the other two dimensions |
Each task’s analysis follows a unified template with six parts: (1) the task card — business goal and trigger, initial context and data assets, human responsibilities and clarifiable items, system end state and required results, scoring composition; (2) each evaluated combination’s performance overview and key differences; (3) key trajectory nodes — typical fragments of localization, clarification, execution, and delivery; (4) scoring reconstruction — itemized rule verdicts, Judge items, and evidence citations; (5) efficiency data — tokens, turns, and end-to-end duration; (6) per-task interpretation — success factors, failure modes, and their business implications. Baseline references (human expert, single-turn direct call, random baseline) are cited where needed.
Example 1 Batch Recognition and Posting of Multiple Invoices (Image Processing · L2 · single-turn; task card in Section 2.4.3, Example 1)
Performance overview: Lingee’s Task Score is 1.0 — all 23 rule groups passed and all five Judge items passed. DeepSeek Harness’s three tool-calling modes clearly diverged on this task: the standard function-calling mode also earned a perfect score; Code Mode (batch-orchestrating tool calls via generated code) ended its session without doing effective work, scoring zero for the task; the dual mode (both calling styles open) scored 0.87, misrecognizing all three invoice numbers while getting only the amounts and the total right.
Trajectory and scoring: The dual mode’s losses all fell on the source-reference checks for invoice numbers — recognition accuracy for easily confused characters in small-print numbers (O vs. 0, I vs. 1) is a direct test of raw OCR capability. Lingee got all three right, completing recognition, summation, and table writing before the timeout brink, and its artifact discipline was simultaneously certified by the Judge.
Efficiency and interpretation: This task shows that session stability is a precondition for heavy tasks — Code Mode generates a large volume in one shot with a large error surface, and a single failed session zeroes the task; at the recognition layer, amounts are usually read correctly, while high-confusion strings like invoice numbers are the real watershed.
Example 2 Cost Overrun Attribution Drill-Down (Data Analysis · L3 · multi-turn; task card in Section 2.4.3, Example 2)
Performance overview: Lingee’s Task Score is 1.0 — the three turns of computation (department overrun rates, the largest-overrun department, account drill-down amounts, remediation figures) passed all six rule groups, and all three Judge items passed. DeepSeek Harness’s standard mode scored 0.883, with all five business-content groups passing and the only loss on the output safety banned-words group; its Code Mode and dual mode also reached 1.0; OpenCode’s loss on this task likewise fell on the safety-compliance rule group.
Trajectory and scoring: Cross-turn chaining is the main test point — the analysis targets of turns 2 and 3 never appear in the statement and are determined dynamically by earlier conclusions; Lingee’s three turns of numbers cross-footed at every level without mid-course drift. The control groups’ computations were themselves correct; their losses came from disclaimer templates in the remediation advice reverse-hitting the statement’s banned words (wording like “investment advice” and “tax planning”).
Efficiency and interpretation: This task is a classic of “both content answers right, compliance decides the winner” — whether the output wording is business-like (concrete actions such as renegotiating prices or adjusting purchase lots) rather than a templated fallback directly decides the rule-group outcome; final-turn artifact assembly and cross-turn consistency are another implicit test of multi-turn tasks.
Example 3 Refund Reversal Chain Tracing (Knowledge Base Retrieval · L4 · single-turn; task card in Section 2.4.3, Example 3)
Performance overview: Lingee’s Task Score is 1.0 — all 23 rule groups passed and all six Judge items passed, a dual-channel perfect-score exemplar of the knowledge-base-retrieval category. The verdict focuses on the citation-grounding and no-fabrication items: source annotations of key conclusions must really exist and point correctly; the evidence list and excerpts the Judge relies on were frozen before evaluation, and the Judge does not access the workspace.
Trajectory and scoring: The seven questions interlock, and the retrieval cue for each later question (a concept, document, or parameter name) must come from articles read for earlier ones — Lingee launched each next retrieval with terms from already-retrieved content, made no mismatch amid coexisting articles on similar topics, kept citations strictly within the evidence list, and additionally covered implicit points not hinted at in the statement that had to be distilled from the knowledge-base originals.
Efficiency and interpretation: Evidence discipline decides the credibility of knowledge-base QA — adding one plausible-looking source to round out an answer constitutes a hallucinated citation and forfeits the whole item; “cite less rather than extrapolate” secures verifiability better than answering exhaustively.
Example 4 December Business Analysis Report (Finance · single-turn; task card in Section 2.5.4, Example 1)
Performance overview: Lingee’s Task Score is 1.0 — all four numeric verification groups (operating revenue; total assets, total liabilities, and asset-liability ratio; cash and cash equivalents; net operating cash flow) were delivered and matched the confirmed values, all 16 content criteria’s analysis topics were covered, and the dual-format Markdown and HTML reports passed manual verification. OpenCode scored Judge 1.0, rule 0, Task Score 0.70; DeepSeek Harness scored Judge 0.84, Task Score 0.59.
Trajectory and scoring: Data-fetch depth is the primary difference — Lingee’s 55 tool calls covered multi-period income statements (including all twelve months), three periods each of the balance sheet and cash flow statement, account balances, and dimension data, from which it identified conclusions unreachable from a single-period slice, such as anomalous revenue trends and a structural divergence between prepayments and revenue; the two control groups made 16–21 calls each, fetched only the December single-period slice, and did no trend analysis. The rule score of zero was not arithmetic error — most numbers in the control groups’ body text were actually correct; the losses all came from the result-table contract: operating revenue not reported in the result table, non-compliant amount-unit annotation, and cash-flow column positioning.
Efficiency and interpretation: Lingee’s HTML report built in machine self-checks (chart count, drawer navigation, data provenance, no leftovers) and passed item by item — a step the control groups skipped. This task shows that multi-period, multi-source data fetching and artifact self-checks are the scoring foundation of analysis-report tasks, and that “correct body text” and “compliant result table” are two independent capabilities.
Example 5 January Sales Monthly Report (Supply Chain · single-turn; task card in Section 2.5.4, Example 2)
Performance overview: Lingee’s Task Score is 1.0 — all four numeric verifications (booking amount, order count, on-time delivery rate, return rate) were delivered and matched the confirmed values; customer and material contributions, delivery exceptions, collection risk, and next-month recommendations were all present; the monthly report passed manual verification. OpenCode scored Judge 1.0, rule 0, Task Score 0.60, with the two ratios marked “not provided”; DeepSeek Harness timed out within the 1,200-second budget without producing any artifact, Task Score 0.
Trajectory and scoring: How data is fetched is decisive — Lingee used server-side filtering to fetch everything at once (combined filters on document status, approval-date window, and sales organization); five calls retrieved the current month, month-over-month, year-over-year, and two status-scope datasets respectively. OpenCode did 13 paginated offset binary-search probes on the same data just to confirm the total; DeepSeek Harness dispatched three sub-agents to dump page by page, each page costing one model call. Metric-convention knowledge is the second watershed: the control groups could only page blindly through the metrics interface, and upon seeing zeros concluded “system-integrated metrics, unusable,” wrote “not provided” for the two ratios, and took rule-score zero for “no applicable reference.”
Efficiency and interpretation: Compressing data-acquisition cost from “pages × model calls” to a constant number of calls is this task’s most striking efficiency difference, and it directly decided DeepSeek Harness’s timeout. Lingee explicitly marked the two metrics whose interfaces timed out as “unknown, not zero,” and the contract discipline of not filling missing data with zero was likewise verified.
Example 6 Two-Day Process Quality Comparison (Manufacturing · single-turn; task card in Section 2.5.4, Example 3)
Performance overview: Lingee’s Task Score is 1.0 — all five overall metrics matched the confirmed values, plus a high-risk process list, two visualization reports, and three business recommendations. OpenCode scored Judge 1.0, rule 0.83, Task Score 0.93, with a miscount of total defects; DeepSeek Harness scored Task Score 1.0.
Trajectory and scoring: This task’s hidden test point is pagination completeness — Lingee fetched all of each day’s records in one call with a one-shot page size, and after the first empty result self-corrected the timestamp precision of the date parameter; OpenCode discarded the first page’s two valid records as empty values, losing three defect details and miscounting; DeepSeek Harness, finding a row-count gap, ran four rounds of cross-verification by document number and process code to fill it. Computation also differed: Lingee delegated metric computation to a script and relayed the results, while OpenCode computed entirely in-model, with the final model call’s output reaching 3.1 MB.
Efficiency and interpretation: Fetching a full page up front avoids row loss at the source, better than after-the-fact self-check repair; combining deterministic computation with artifact self-checks is a stable path for number-heavy tasks balancing score and efficiency. The three combinations’ gap on this task is smaller than on the previous two, showing that when a task’s conventions are fully public and counting dominates, capability gaps narrow.
Across the six task-by-task analyses, there are two key findings.
Key finding 1: The first watershed in enterprise business scenarios is domain data access, not computing power. In the three enterprise tasks, Lingee used interface selection, server-side filter parameters, and metric-convention knowledge to fetch all needed data in a constant number of calls; the two control groups relied on blind pagination, offset binary-search probing, or sub-agent page-by-page dumps, and on the heaviest task — the sales monthly report — produced no artifact within budget. “Knowing what to query and with which parameters” decides whether the task can be done at all; only then does “computing correctly” matter.
Key finding 2: Content correctness and delivery compliance are two independent capabilities, and dual-channel scoring measures them separately. On the enterprise side, most numbers in the control groups’ body text were correct, yet they lost rule-channel points for non-compliance with the result-table contract (metrics not in the table, wrong units and column positioning); on the general side, the control groups’ computation and retrieval content was correct, but disclaimers in the output systematically triggered safety banned words and lost points, while Lingee triggered none throughout. The implication for business owners: “verifiable results” and “trustworthy artifacts” must be accepted separately — either shortfall shows up explicitly in the Task Score.
5.3 Boundaries on Result Use and Comparison Conventions
This benchmark is positioned as a versioned evaluation suite, not a general ranking leaderboard. The first round completed a controlled comparison across Lingee, DeepSeek Harness, OpenCode — three Harness implementations — on the 65-task public group, following one comparison convention, the controlled-configuration comparison: tasks, tool contracts, initial environments, budgets, and scoring assets fixed, with only the evaluated agent combination switched, to observe the respective contributions of model, context organization, tool use, and execution framework. It does not equal the experience of a customer adopting a complete product, nor does it constitute an evaluation of other models or other Harness ; Harness-effect research has shown that cross-Harness score differences can reach tens of points [5][12][13]; systems lacking adaptation are marked “not covered” with reasons in this benchmark, not treated as zero capability. The two domains’ scorers differ, so scores are not summed across domains and no overall average is reported; the six-task cases are not a statistical sample and are not used to infer overall performance or rank.
Statistics and extrapolation boundaries: small gaps within the noise band of repeated evaluation are not evidence of real differences between combinations [14][13]; differences observed in cases are read through trajectories and evidence, not extrapolated from single-task outcomes. The offline-sandbox boundaries apply equally: results are not extrapolated to online scenarios with network access, real-time data, and real approval flows, nor directly converted into business coverage, job replacement rates, or cost savings (see Section 3.2 and Chapter 6). Once results from multiple systems under the same protocol accumulate, this benchmark will extend to cross-system benchmarking; at that point, comparison of complete product forms (each product connected with its officially available capabilities, under unified business goals, initial states, and total budgets) and comparison against humans and existing processes will be published as a separate comparison protocol (see Chapter 8).
6Business Value and Adoption Validation
This chapter explains how this benchmark’s results connect to business value. A declaration first: as of this release, all evaluations were completed in the offline sandbox, with no customer pilots or commercial adoption data yet; this chapter gives a validation plan and measurement conventions, not any verified value conclusions. Offline success rates on a limited task pool do not directly convert into real business coverage, job replacement rates, or annual savings.
6.1 Three-Layer Evidence Framework
The benchmark decomposes the claim “agents have business value” into three layers of evidence, validated and disclosed layer by layer. Capability evidence: task and process performance in the offline sandbox (see Section 5.2); business evidence: confirmed outcomes and actual improvements against pre-agreed business acceptance criteria in customer pilots; operating evidence: sustained operation, contracted revenue, and delivery economics. The layers connect as follows: capability evidence is necessary but not sufficient — passing the sandbox shows the foundation to take on business; customer pilots verify performance under real constraints; operating evidence confirms commercial viability.
6.2 Customer Pilot Validation Plan
Customer pilots are designed around joint acceptance. Task sources: representative tasks drawn from the customer’s real business, aligned with the benchmark’s task families, executed within the customer’s data and permission environment. Acceptance criteria: the customer’s business experts and delivery team agree in advance on business end states and necessary controls; acceptors, observation windows, and exclusion conditions are fixed in writing before the pilot starts. Control design: a concurrent control, phased rollout, or matched-process comparison may be used; the baseline performance of the existing process (time, quality gates, rework) is recorded first, then the agent solution is introduced to measure change; the pilot covers at least a normal business cycle and typical exception events, and results from simulated environments or test tenants do not substitute for real business acceptance.
6.3 Measurement Conventions for Adoption and Value
Four classes of metrics are measured during pilots and adoption: first-pass rate — the share of submissions passing business acceptance on the first try; human effort — effective working hours spent reviewing, clarifying, approving, and rescuing, with protocol-required human approvals recorded separately from extra human rescue, so that required collaboration is not miscounted as capability failure; cost per accepted success — total trial cost (including failures, retries, reviews, takeovers, and rework) divided by the number of accepted successes, marked “not computable” when successes are zero; delivery timeliness — end-to-end completion time versus effective human working time. Value assessment uses the net-incremental-value convention: confirmed incremental gains and actual cost improvements, minus all incremental costs of the AI solution (software, inference, integration, governance, and maintenance). Released hours are first booked as capacity improvement and counted as cash savings only when actual changes occur in overtime, outsourcing, or staffing costs; released working capital and profit improvement are computed separately to avoid double counting.
6.4 Boundaries and Disclaimers of Adoption Validation
Three statements. First, this chapter makes no commercial value commitment; offline scores must not be used to directly infer business or operating conclusions when citing this benchmark. Second, customer pilots involve customer data and production environments; results are disclosed as cases with customer consent, and pilot data never enters the task pool. Third, the correlation between offline scores and on-site customer performance is itself an object of validation — if the correlation is weak, the task distribution and scoring design should be revised rather than more tasks simply added (see Chapter 8).
7Governance, Versioning, and Ecosystem
A benchmark’s credibility comes half from method design and half from long-term governance. This chapter covers Lingee Bench’s organizational responsibilities, versioning mechanism, and ecosystem rules; the detailed rules are released with the four evaluation specification documents (evaluation protocol, held-out-set governance rules, scoring specification, and statistical reporting specification) (see Appendix C).
7.1 Organization and Separation of Duties
This benchmark was initiated and built by Kingdee; the pipeline and first-round results are both self-built and self-evaluated, and the vendor identity and interests are hereby declared. To control self-evaluation bias, the build enforces separation of duties: task authoring (independent authoring by business experts), evaluation execution (evaluation engineering), scoring-asset maintenance (scoring specification and Judge calibration), and held-out-set governance (submission governance and rotation decisions) belong to different roles; business experts help define expected outputs and arbitrate disputes but do not participate in interpreting results about their own products. Methods, scoring assets, and open-sourced tasks are fully public and support independent third-party reproduction and audit — public reviewability is the most direct check on vendor identity (see Section 4.3 Judge quality verification and Section 3.3 multi-baseline cross trial runs).
7.2 Version and Update Governance
Version semantics: tasks, data, environments, protocols, and judge assets are numbered separately; major definitional changes open a new version; the evaluation task set is frozen after review (version freeze), tasks inside a frozen version are never modified, unreasonable items found during evaluation go into a problem queue, fixes go into the next version with a complete re-run on it, and cross-version results are not directly compared (see Section 3.3).
Continuous update and version rotation: at each version iteration, some held-out tasks rotate to public while new held-out tasks are added — the public benchmark stays fresh and the calibration group stays present; the open-source scale grows version by version, and the public group’s representativeness of the overall distribution keeps strengthening.
Controlled evaluation via the official website follows explicit submission governance rules, preventing the held-out group from degrading into a repeatedly probed development set: submission quotas and cooldowns — submissions per account per task version are capped, with cooldown periods between submissions; limited feedback granularity — the evaluation service returns only aggregate scores at overall and per-domain levels, never per-task right/wrong feedback; accounts and audit — submitting accounts are registered under real names, with submissions and queries logged end to end; anomaly detection and rotation — submission patterns showing abnormal short-term gains or suspected per-task probing are detected, and held-out tasks crossing thresholds enter the rotation queue; result confidentiality — results are not published without the submitter’s consent, and public display follows the release policy.
Update cadence and retirement: errata and targeted regressions are handled monthly; comparable results are published quarterly or on major changes; tasks saturated at the top are retained as regression cases; contaminated, distorted, or outdated tasks enter a publicized retirement list; adding hard tasks never silently changes historical scores — affected past results are recomputed or annotated per version semantics.
7.3 Ecosystem Contributions and Appeals
The benchmark accepts contributions from industry partners and researchers, including tasks and scenarios, industry data and environment definitions, and validators and Judge calibration cases. Contributions follow unified rules: tasks must pass the seven-dimension inspection and business-reasonableness review (see Section 3.3); data must meet source-publicity and desensitization requirements (see Section 3.1); validators must pass the random-baseline soundness check (see Section 4.2); accepted contributions enter the task pool in versioned form, with contributors credited and cited in results. Disputes over evaluation results may be escalated through the appeal channel for joint arbitration by business experts and the evaluation team, with arbitration conclusions and scoring-asset revisions publicized in version records. The goal of ecosystem governance is to move the benchmark from a vendor build to joint construction: clear contribution rules, an independent reproduction channel, and transparent appeal handling will gradually build industry credibility.
8Limitations and Roadmap
The benchmark has five limitations. First, limited task scale and business coverage: the 1,400 tasks cover the finance, supply-chain, and manufacturing dimensions, while management domains such as HR, marketing, and legal are not yet included. Second, scenario specificity: tasks are rooted in the Kingdee ERP ecosystem and Chinese enterprise scenarios; extrapolating conclusions to other enterprise software ecosystems or languages requires caution. Third, the expression boundary of validation: deterministic rules cannot cover fully open tasks; the LLM Judge extends the evaluable range but introduces the inherent biases of a model judge, which this framework mitigates — through evidence binding and dual-channel separation — but does not eliminate. Fourth, snapshot-exposure risk: a released benchmark risks being absorbed into training corpora; version management mitigates but does not eliminate this. Fifth, limited combination coverage: the first round covers only Lingee, DeepSeek Harness, OpenCode — three evaluated combinations — and does not constitute an evaluation of other models or Harness.
Future work proceeds in three phases. Near term (with the first release): deepen in-sandbox coverage of controls — approval and separation of duties, idempotency of repeated execution, and undo/rollback/compensation scenarios further incorporated into the exception-handling dimension and fatal-item design; complete the full-set result review and decide the release channel and form of evaluation results; iterate product and evaluation assets driven by failure-mode analysis. Mid term: extend the organizational-collaboration tier — with cross-role, cross-time business events as the evaluation unit, examining shared goals, responsibility handover, authorized escalation, and human takeover; build online and permission evaluation tracks (controlled versions of network access, real-time data, and approval flows); and, while keeping the disclosure standard, extend to multi-system same-protocol matrix evaluation with public comparison. Long term: extend industry task packages by industry tag and co-build with industry partners (see Chapter 7); explore task-assisted generation and automated inspection to raise task production efficiency; and explore evaluation treating the Harness as an evolvable variable [13]. The phases carry no fixed timetable; progress follows evidence accumulation and governance readiness.
9Appendices
Appendix A Glossary
Table A-1 Glossary
| Term | Definition |
|---|---|
| Lingee Bench / lg-bench | The name and code name of this benchmark; comprises the general domain and the enterprise management domain |
| Lingee | An enterprise-grade Agent operating system developed by Kingdee |
| General domain / enterprise management domain | The two task domains: the former measures foundational office and engineering capabilities; the latter measures end-to-end task capability in ERP business scenarios |
| Task directory | The self-contained packaging unit of a task: task definition, execution environment (with the packaged workspace), and scoring assets (tests/) |
| Episode | The complete process of one task run, from environment startup to agent stop |
| Deferred evaluation assets | The execution-time isolation mechanism whereby validation assets are introduced only after the Episode ends |
| Expected outputs | The business-correct result of a task; together with validation rule files it forms the basis of deterministic validation |
| Validation rule file | The file defining task-level deterministic validation rules, including fatal and ordinary items |
| Rule score / Judge score | Deterministic-validation pass rate / normalized-level average of the LLM Judge’s graded-level scoring items |
| Task Score | Primary metric: the task-level score ∈ [0,1] composing rule and Judge scores with task weights |
| Macro-average | Aggregation by simple averaging of task scores over a task set |
| Fatal item | A rule whose validation failure sets the task score to 0 (e.g., unbalanced debits/credits, unauthorized operation) |
| reliability@k | The proportion of k independent runs of the same task that all succeed; a stability metric |
| Turns | The count of agent message rounds in one run |
| locked-harness | An evaluation format that locks a unified execution scaffold and fully discloses its configuration |
| Underspecification | The construction design that deliberately omits target files, interfaces, and boundaries from task descriptions |
| Task family | Independent business scenarios not substitutable for one another under the same business goal; template variants within a family count as one independent scenario |
| Three-tier evaluation architecture | The evaluation tiers: foundational capability (general domain, work-package level) — business process (enterprise management domain, task-chain level) — organizational collaboration (cross-role event handling, extension direction) |
| Result card | The unified configuration-disclosure unit released with results: the seven-layer HarnessCard plus budgets, human-assistance rules, environment snapshot version, and run date |
Appendix B Data Source Statement
All evaluation task-set data is synthesized from public materials. Public blueprints include: the Kingdee Community Help Center (product knowledge such as expense management and Renren Baoxiao, https://vip.kingdee.com), Kingdee investor-relations public financial-report materials, and public ESG reports. The business data assets synthesized on top (tenants, customers, contracts, documents, tickets, etc.) are all fictitiously constructed and correspond to no real enterprise data.
Appendix C Release Content List
This appendix declares item by item the content boundary of Lingee Bench: what is released, what is not, and what data was never used. It describes only the content boundary, not release channels or timing.
Table C-1 Release content list
| Content | Status | Description |
|---|---|---|
| White paper (this document) | Released | Evaluation framework, metric system, scoring mechanism, and six-task in-depth case analyses |
| Evaluation tasks and task directories (public group, first batch of 65) | Released | Task descriptions and workspace data assets; open-source, downloadable, and reproducible offline |
| Held-out task group (1,335 tasks) | Not released | Not directly open-sourced; evaluated via the official Lingee Bench website; identically distributed with the public group; used for contamination monitoring and version rotation |
| Four evaluation specification documents (evaluation protocol, held-out-set governance rules, scoring specification, statistical reporting specification) | To be determined | Executable specifications accompanying the white-paper methodology: access interfaces and clarification interaction; submission governance and anti-cheating; weights, fatal-item catalog, and Judge arbitration; stratified metrics, confidence intervals, and version comparability rules; release scope to be decided with the release version |
| Evaluation environment definitions | Released | Docker build definitions supporting offline reproduction |
| Unified result-card template | Released | Template of configuration and run conditions for each evaluated combination, released with the evaluation results |
| Validation rules | Released | Deterministic validation rules and Judge scoring rules are public, supporting evaluation reproduction and scoring audit |
| Expected outputs | Not released | Business-correct task results are kept confidential to prevent answer leakage and benchmark-targeted optimization |
| First-round evaluation statistics (Lingee, DeepSeek Harness, OpenCode × 65-task public group) | Under review | The evaluation runs are complete and the results are under review; they will not be disclosed until approved. The white paper contains no aggregate statistics, presenting only the six-task deep dives; the release channel and form will be decided with the release version |
| Six-task in-depth case analyses | Released | Task-by-task analysis of 3 general-domain tasks plus 1 each from finance, supply chain, and manufacturing; see Chapter 5 |
| Full-scale evaluation run results (1,400 tasks) | Under review | The evaluation runs are complete and the results are under review; they will not be disclosed until approved |
| Full evaluation details such as raw trajectories | Not released | — |
| User data and real enterprise data | Never used | Evaluation task-set data is synthesized from public materials and corresponds to no real enterprise data |
| Internal task-pool evolution information | Not released | Externally, the release version is the first version |
Note: “never used” means not used at any point of task construction or evaluation.
Appendix D Industry Benchmark Survey List
This appendix is the complete list of industry evaluation leaderboards underpinning the argument of Section 1.2. The survey covers 37 benchmarks organized into five categories — General Agent (12), Web/GUI (8), Code Engineering (8), Enterprise Office (5), and Aggregators (4); 15 of them are benchmarks led or co-released by model and cloud vendors (Tencent, ByteDance, Alibaba, Huawei, MiniMax, Microsoft, Google, AWS, Apple, OpenAI, Meta, and Zhipu), belonging to the General Agent, Code Engineering, and Web/GUI categories; survey dimensions cover evaluation scenario, data open-sourcing, scoring method (whether an LLM Judge is used), reproducibility, and update status. Table D-1 excerpts the information most relevant to this paper’s argument, for readers to trace.
Table D-1 Survey list of 37 industry evaluation leaderboards
| No. | Leaderboard | Category | Host organization | Evaluation scenario | Data open-source | LLM Judge | Updates |
|---|---|---|---|---|---|---|---|
| 1 | AgentBench | General Agent | Tsinghua University THUDM (Jie Tang / Minlie Huang teams) | General agent, 8 environments: OS/DB/KG/card game/puzzles/household/shopping/browsing | Yes | No | Yes |
| 2 | GAIA | General Agent | Meta AI/FAIR + Hugging Face (Yann LeCun, Thomas Wolf, etc.) | General AI assistant (multimodal: text/audio/documents/images) | Partial | No | Yes |
| 3 | τ-bench (tau-bench) | General Agent | Sierra (founded by Bret Taylor; valued at USD 4.5B) | Tool–agent–user interaction (airlines/retail/telecom/banking) | Yes | No | Yes |
| 4 | xbench | General Agent | HongShan Group (HSG, formerly Sequoia China) | AGI capability frontier + practical industry use (ScienceQA/DeepSearch/recruiting/marketing) | Yes | Yes | Yes |
| 5 | BrowseComp | General Agent | OpenAI | Web-browsing agent (hard-to-solve browsing tasks) | Yes | Yes | No |
| 6 | DeepResearch Bench | General Agent | Research team (Ayanami0730, 100+ domain experts involved) | Deep-research agent (PhD-level cross-domain tasks) | Yes | Yes | Yes |
| 7 | WebArena | Web/GUI | CMU NeuLab (Graham Neubig) | Web automation (e-commerce/forums/GitLab/maps/Wikipedia) | Yes | No | Yes |
| 8 | VisualWebArena | Web/GUI | CMU (same team as WebArena) | Multimodal visual web tasks (requires understanding page screenshots) | Yes | No | No |
| 9 | OSWorld | Web/GUI | HKU XLang Lab (with Salesforce/CMU/Waterloo) | Real-OS desktop GUI (Ubuntu/Windows VMs) | Yes | No | Yes |
| 10 | Mind2Web | Web/GUI | OSU NLP Group (Ohio State University) | Web-agent generality (offline HTML snapshots; generalization across tasks/sites/domains) | Yes | Yes | Yes |
| 11 | WebShop | Web/GUI | Princeton NLP Group (Karthik Narasimhan) | E-commerce shopping (mock shopping site; 1.18M real products) | Yes | No | No |
| 12 | AndroidWorld | Web/GUI | Google Research/DeepMind (Alphabet) | Android mobile GUI (116 tasks, 20 real apps) | Yes | No | Yes |
| 13 | SWE-bench | Code Engineering | Princeton (Carlos Jimenez, Alexander Wettig, et al.) | Real GitHub issue resolution (software engineering, 12 Python repos) | Yes | No | Yes |
| 14 | SWE-bench Verified | Code Engineering | Princeton + OpenAI collaboration | Human-verified SWE-bench subset (500 tasks) | Yes | No | No |
| 15 | LiveCodeBench | Code Engineering | UC Berkeley / MIT / Cornell | Live code generation (LeetCode/Codeforces/AtCoder) | Yes | No | Yes |
| 16 | Terminal-Bench | Code Engineering | Stanford × Laude Institute (harbor-framework) | Terminal command-line tasks (hard, realistic) | Yes | No | Yes |
| 17 | OfficeBench | Enterprise Office | UC San Diego / UCLA / Allen Institute for AI (AI2) | Multi-app office automation (9 mock apps in Docker: Word/Excel/PDF/Calendar/Email/OCR/ChatGPT/Shell) | Yes | No | No |
| 18 | WorkArena | Enterprise Office | ServiceNow Research (NYSE: NOW; USD 13.29B revenue in 2025) | Enterprise knowledge work (6 categories on the ServiceNow platform: knowledge base/forms/service catalog/lists/charts/dashboards) | Restricted | No | Yes |
| 19 | Salesforce CRM Benchmark | Enterprise Office | Salesforce AI Research (NYSE: CRM; USD 41.525B revenue in FY2026) | CRM (three areas: Sales/Service/Field Service) | No | No | Yes |
| 20 | DrBench | Enterprise Office | ServiceNow Research | Enterprise-grade deep research (10 domains incl. Sales/cybersecurity/compliance; 3 industries: retail/healthcare/EV) | Yes | Yes | Yes |
| 21 | AgentLab | Enterprise Office | ServiceNow Research | Evaluation framework (aggregates 12+ benchmarks: WorkArena/WebArena/OSWorld/MiniWoB, etc.) | N/A | No | Yes |
| 22 | LMArena (Chatbot Arena) | Aggregator | LMSYS Org (UC Berkeley/UCSD/CMU; academic non-profit) | General LLM/agent dialogue (crowdsourced human-vote Elo) | Yes | No | Yes |
| 23 | Artificial Analysis | Aggregator | Artificial Analysis (commercial company) | LLM/agent aggregate comparison (dedicated Agentic Index and Coding Agents sub-boards) | No | N/A | Yes |
| 24 | LLM-Stats | Aggregator | YC S25 startup | LLM/agent aggregate comparison (300+ models) | Partial | N/A | Yes |
| 25 | OpenLegion | Aggregator | OpenLegion (agent-runtime company) | Benchmark commentary articles (not an independent leaderboard; aggregates SWE-bench/GAIA/WebArena, etc.) | N/A | N/A | — |
| 26 | Tencent WorkBuddy Bench | General Agent | Tencent (38-author team) | Multi-domain coding agent (Code/Web/Office/Security) | Yes | Partial | Yes |
| 27 | Multi-SWE-bench | Code Engineering | ByteDance Seed | Multilingual coding agent (7 languages: Java/TS/JS/Go/Rust/C/C++) | Yes | No | Yes |
| 28 | Web-Bench (ByteDance) | Code Engineering | ByteDance | Web-development agent (front-end development, sequential dependent tasks) | Yes | No | Yes |
| 29 | EdgeBench | General Agent | ByteDance Seed | Long-horizon autonomous-learning agent (science/ML/systems engineering/optimization/knowledge/games; up to 12 hours) | Yes | No | Yes |
| 30 | DeepPlanning (Qwen) | General Agent | Alibaba Qwen team | Agent planning (travel planning 120 tasks each in Chinese and English + shopping planning 120 tasks) | Yes | No | Yes |
| 31 | OmniBench (Huawei) | General Agent | Huawei Yunqi Innovation Team + PKU/RUC/BIT/Tsinghua | All-scenario agent (22 consumer + 38 enterprise + 30 employee domains); ten capability dimensions incl. office tasks | Yes | Unclear | Yes |
| 32 | OctoCodingBench (MiniMax) | Code Engineering | MiniMax | Coding-agent process compliance (instruction-following across 7 sources: system prompt/user query/AGENTS.md/skill calls, etc.) | Yes | Unclear | Yes |
| 33 | Windows Agent Arena (WAA) | Web/GUI | Microsoft Research | Windows desktop OS-level tasks (document/spreadsheet editing/browsing/system operations/coding/tools) | Yes | No | Yes |
| 34 | aws-bench (AWS) | Code Engineering | Amazon/AWS | AWS cloud-ops agent (Introspection diagnosis + Mutation to create/modify AWS resources) | Yes | Partial | Yes |
| 35 | MMAU (Apple) | General Agent | Apple Foundation Models team (Ruoming Pang, Zirui Wang, et al.) | Multi-task agent understanding (tool calls/DAG QA/data-science coding/competitive programming/math; 5 domains × 5 capabilities) | Yes | No | Yes |
| 36 | ToolSandbox (Apple) | General Agent | Apple | Stateful multi-turn conversational tool calling (implicit state dependencies between tools) | Yes | Unclear | Yes |
| 37 | VisualAgentBench (VAB) | Web/GUI | Zhipu AI (Tsinghua University THUDM team) | Visual agent (embodied/GUI/visual design; 5 environments: OmniGibson/Minecraft/Mobile/WebArena-Lite/CSS) | Yes | No | Yes |
Note: survey information is compiled from each benchmark’s paper, official documentation, and public leaderboard pages as of the writing of this white paper. The “data open-source,” “LLM Judge,” and “continuously updated” columns are coarse classifications; details such as open-source licenses, contamination safeguards, and update mechanisms are subject to each benchmark’s official materials.
Appendix E Related Work
E.1 Literature and Benchmark Landscape
Agent evaluation research falls into six threads. First, the Harness evaluation thread (latest 2026 progress): Harness-Bench measures configuration-level Harness effects and establishes the “controlled-factor” experimental paradigm [9]; Stop Comparing proposes the seven-layer disclosure checklist and a variance-decomposition protocol [5]; The Harness Effect reveals the orchestration layer’s decisive role in enterprise-agent token costs [15]; Rethinking Harness Evolution establishes the “separation of optimization feedback from final measurement” principle [8]; HarnessOpt-Bench proposes noise bands and headroom-normalized gains [14]; GABench and HarnessDev provide cross-Harness gap evidence [12][13]. Second, highly cited surveys: the KDD’25 panoramic agent-evaluation survey [1], the five-perspective evaluation survey [16], and the harness-aware four-factor framework survey [2]. Third, classic agent benchmarks: GAIA [17], SWE-bench [18], OSWorld, WebArena, AgentBoard, etc. Fourth, enterprise-domain benchmarks: τ-bench and τ²-bench [10], CRMArena [19], WorkArena [20], WorkBuddy Bench [6], ITBench. Fifth, judge methodology: MT-Bench and Chatbot Arena, Agent-as-a-Judge [7], and the LLM-as-a-Judge survey [21]. Sixth, position and standardization: AI Agents That Matter advocates jointly reporting accuracy with cost and reproducibility [22]; CUBE explores a unified agent benchmark standard.
E.2 Comparison with Representative Benchmarks
Table E-1 compares seven representative benchmarks with this benchmark on six dimensions: scenario, contamination prevention, scoring method, business-grade validation, reproducibility, and configuration disclosure.
Table E-1 Comparison of representative agent benchmarks
| Benchmark | Scenario | Contamination prevention | Scoring method | Business validation | Reproducible / disclosure |
|---|---|---|---|---|---|
| GAIA | General assistant | test answers withheld | exact match | None | reproducible / no disclosure framework |
| SWE-bench | Code engineering | gold patches public; contamination risk | hidden tests | None | reproducible / no disclosure framework |
| τ-bench | customer-service dialogue | data open-sourced | deterministic state verification | dialogue domain | reproducible / pass^k |
| OSWorld | real OS | data open-sourced | hybrid judgment | None | reproducible / no disclosure framework |
| WorkArena | enterprise SaaS | data open-sourced | deterministic validation | ServiceNow | access requires approval |
| CRMArena | enterprise CRM | synthetic data | mostly deterministic + human | Salesforce CRM | reproducible |
| WorkBuddy Bench[6] | Multi-domain coding agent | task statements unsearchable | rule + Judge dual channel | office scenarios | open release / dual Harness |
| Lingee Bench | general office + ERP business | constructive synthesis + versioning | rule + Judge dual channel + expert confirmation | Finance / Supply Chain / Manufacturing | fully self-contained offline Docker / locked-harness seven-layer disclosure |
Note: the comparison is compiled from public materials and the 37-leaderboard survey (full list in Appendix D); each benchmark’s characteristics are per its paper and official documentation.
E.3 Differentiated Positioning
Within this landscape, Lingee Bench’s differentiated positioning has four points. Scenario: the only enterprise-grade benchmark taking ERP core business (finance, supply chain, manufacturing) as its core evaluation scenario, filling the gap of enterprise-office benchmarks’ “simulated environments or closed systems.” Validation: on top of the deterministic-rule and LLM Judge dual channel, it introduces business experts manually confirming expected outputs, giving “business-grade correct” an accountable verdict source. Framework: the locked-harness format with full seven-layer configuration disclosure, fully self-contained offline Docker reproduction, and continuous task updates directly answers the new requirements on evaluation credibility raised by Harness-effect research and reproducibility discussions. Contamination prevention: identically distributed public/held-out dual groups make contamination measurable, monitorable, and governable — better than static practices relying only on constructive rewriting or answer secrecy.
Appendix F Task Directory Specification and Complete Example
The task directory is Lingee Bench’s basic release unit: each task corresponds to a self-contained directory carrying the task definition, execution environment, and all scoring assets, independently buildable, runnable, and reproducible (task metadata in Section 2.6, execution environment in Section 3.2). This appendix gives the field-level specification of the task directory and uses the public-group task “Refund Reversal Chain Tracing” as the complete example; its task card is Section 2.4.3, Example 3.
F.1 Field-Level Task Directory Specification
A task directory consists of three parts: task definition (instruction.md and task.toml), execution environment (environment/), and scoring assets (tests/, the concrete form of the three validation-asset classes described in Section 2.6). Each file’s responsibilities and key fields are in Table F-1.
Table F-1 File composition and responsibilities of a task directory
| File / directory | Part | Responsibilities and key fields |
|---|---|---|
| instruction.md | Task definition | The only task statement visible to the agent: business scenario, input assets, task conventions, artifact contract, and safety constraints |
| task.toml | Task definition | Task metadata: task ID and name, capability category and subcategory, difficulty tier and task tags, execution budgets (agent and grading timeouts), environment resource declarations (CPU, memory, storage, build timeout) |
| environment/Dockerfile | Execution environment | Image definition: base image and preinstalled runtimes (Python 3.12 and Node.js 20 for the example task) |
| environment/docker-compose.yaml | Execution environment | Container orchestration definition |
| environment/workspace.tar.gz | Execution environment | Initial workspace assets; unpacked into the input/ files |
| tests/verifier.toml, tests/test.sh | Scoring assets | Grading runner config & entry: grading command, timeout, and working directory |
| tests/judge.yaml | Scoring assets | Scoring configuration: artifact inventory, Judge scoring items (ID, scoring question, designated evidence, per-level criteria), and dual-channel weights |
| tests/gold/gold_answer.json | Scoring assets | Gold answers and rule-group definitions (expected outputs) |
| tests/gold/judge_evidence.json | Scoring assets | Judge fixed evidence: list of source articles, excerpts from knowledge-base originals, and the scoring-item-to-evidence mapping, frozen before evaluation |
| Three classes of admission samples under tests/gold/ | Scoring assets | Admission-check samples for the grading configuration: the gold answer must receive full marks, the baseline answer zero, and an adversarial answer that hits every keyword but is semantically wrong must receive partial credit |
| tests/grading/ | Scoring assets | Grading implementation: rule scoring, Judge invocation, and artifact-extraction scripts |
Source and licensing information is recorded with the task metadata, consistent with the publicity classification of Appendix B; this appendix gives the composition specification of the release-version task directory, and individual field values are subject to the release version.
F.2 Complete Task Directory Example
The example is “Refund Reversal Chain Tracing” (Knowledge Base Retrieval, L4). Among the 65 public-group tasks, it has the most complete hierarchy of scoring assets — knowledge-base input, 23 rule groups, six Judge scoring items, frozen evidence, and all three admission-sample classes — so it can walk through every part of the directory specification. Its directory structure is as follows:
KBR-refund-reversal-chain-tracing-L4/
├─ instruction.md         Task statement & artifact contract
├─ task.toml              Task metadata & environment
├─ environment/
│  ├─ Dockerfile          Image (preinstalled runtimes)
│  ├─ docker-compose.yaml Container orchestration
│  └─ workspace.tar.gz    Workspace → input/kb/ (69-article KB mirror)
└─ tests/
    ├─ verifier.toml / test.sh   Grading runner config & entry
    ├─ judge.yaml               Scoring config (6 Judge items, weights)
    ├─ grading/                 Grading (run_grade/score_core/judge_core)
    └─ gold/                    gold_answer · judge_evidence · admission samples
Table F-2 Metadata and environment declarations of the sample task (task.toml excerpt)
| Field | Example value |
|---|---|
| Task ID | KBR-refund-reversal-chain-tracing-L4 (release name: Refund Reversal Chain Tracing) |
| Capability category / subcategory | Knowledge base retrieval / multi-source chained retrieval QA (chain-of-RAG) |
| Difficulty and tags | L4; task tags cover domain, capability category, and difficulty tier |
| Execution budget | Agent timeout 1,800 s; grading timeout 1,800 s |
| Environment resources | 2 CPUs, 4,096 MB memory, 10,240 MB storage, no GPU; build timeout 300 s |
| Preinstalled runtimes | Python 3.12 and Node.js 20 (pinned in the Dockerfile) |
| Input assets | input/kb/: a 69-article Markdown knowledge-base mirror; file names are article IDs, and the first line of each file is the article title |
The sample’s judge.yaml declares the single primary artifact output/answer.txt and defines six graded-level scoring items (pass/fail two levels) — the two-step processing order, the hidden-field valuation rule, the attribution of refund methods and amount limits, the travel-case closing, citation grounding, and no fabrication — each binding designated evidence, with dual-channel weights of 0.5 rule and 0.5 Judge. gold_answer.json gives gold answers question by question, checked item by item by the 23 rule groups; judge_evidence.json freezes the list of six source articles and nine excerpts from knowledge-base originals plus the scoring-item-to-evidence mapping, corresponding to the evidence-format specification of Section 4.3. The three admission-sample classes are archived with the directory: the gold answer must score full marks, the baseline answer zero, and an adversarial answer that hits every keyword but is semantically wrong must land in between — only after the grading configuration passes the admission checks is it frozen with the task.
The sample embodies the design intent of the task directory: the statement, environment, and all verdict assets are distributed with the directory, so anyone can build the same environment locally, execute the same task, and run the same grading to obtain comparable results — this is the concrete form of public-group offline reproduction (see Section 4.4) and of reviewable release content (see Appendix C).
10References
[1] Mohammadi M, Li Y, Lo J, et al. Evaluation and benchmarking of LLM agents: a survey[C]//Proceedings of the 31st ACM SIGKDD Conference on Knowledge Discovery and Data Mining. New York: ACM, 2025.
[2] Radwan A Y, Vasilakos A V, Raza S. Harness-aware evaluation of LLM agents: systems, benchmarks, and protocols[PP/OL]. Preprints.org (2026-09-24)[2026-10-20]. https://www.preprints.org/manuscript/202609.2140.
[3] Patwardhan T, Dias R, Proehl E, et al. GDPval: evaluating AI model performance on real-world economically valuable tasks[PP/OL]. arXiv (2025-10-05)[2026-10-20]. https://arxiv.org/abs/2510.04374.
[4] OpenAI. Why we no longer evaluate SWE-bench Verified[EB/OL]. (2026-02-23)[2026-10-20]. https://openai.com/index/why-we-no-longer-evaluate-swe-bench-verified/.
[5] Zhang Y, Wang J, Ge Y, et al. Stop comparing LLM agents without disclosing the harness[PP/OL]. arXiv (2026-05-07)[2026-10-20]. https://arxiv.org/abs/2605.23950.
[6] Cai S, Chen S, Fei X, et al. Tencent WorkBuddy Bench: a multi-domain coding-agent benchmark with contamination-resistant task construction[PP/OL]. arXiv (2026-07-23)[2026-10-20]. https://arxiv.org/abs/2607.20911.
[7] Zhuge M, Zhao C, Ashley D R, et al. Agent-as-a-Judge: evaluate agents with agents[PP/OL]. arXiv (2024-10-16)[2026-10-20]. https://arxiv.org/abs/2410.10934.
[8] Wang Y, Zhu H, Hu Z, et al. Rethinking the evaluation of harness evolution for agents[PP/OL]. arXiv (2026-10-05)[2026-10-20]. https://arxiv.org/abs/2607.12227.
[9] Yao Y, Tan X, Liu C H, et al. Harness-Bench: measuring harness effects across models in realistic agent workflows[PP/OL]. arXiv (2026-05-27)[2026-10-20]. https://arxiv.org/abs/2605.27922.
[10] Yao S, Shinn N, Razavi P, et al. τ-bench: a benchmark for tool-agent-user interaction in real-world domains[PP/OL]. arXiv (2024-06-17)[2026-10-20]. https://arxiv.org/abs/2406.12045.
[11] Anthropic. Demystifying evals for AI agents[EB/OL]. (2026-01-09)[2026-10-20]. https://www.anthropic.com/engineering/demystifying-evals-for-ai-agents.
[12] Tan J, Zhang Z, Guo Y B, et al. GABench: a comprehensive benchmark for evaluating LLM agents on graph analysis tasks[PP/OL]. arXiv (2026-08-03)[2026-10-20]. https://arxiv.org/abs/2608.01684.
[13] Wu Y, Zhang J, Shi J, et al. HarnessDev: can LLMs create and evolve their own agent harness?[PP/OL]. arXiv (2026-09-01)[2026-10-20]. https://arxiv.org/abs/2609.01437.
[14] Ursekar V, Shanker A, Maurya Y, et al. HarnessOpt-Bench: evaluating LLMs at harness optimization[PP/OL]. arXiv (2026-08-06)[2026-10-20]. https://arxiv.org/abs/2608.06301.
[15] Sayed Ali M, Novik A, Boddupally A, et al. The harness effect: how orchestration design sets the token economics of enterprise agentic AI[PP/OL]. arXiv (2026-10-05)[2026-10-20]. https://arxiv.org/abs/2607.06906.
[16] Yehudai A, Eden L, Li A, et al. A survey on evaluation of LLM-based agents[PP/OL]. arXiv (2026-04-23)[2026-10-20]. https://arxiv.org/abs/2503.16416.
[17] Mialon G, Fourrier C, Swift C, et al. GAIA: a benchmark for general AI assistants[PP/OL]. arXiv (2023-11-21)[2026-10-20]. https://arxiv.org/abs/2311.12983.
[18] Jimenez C E, Yang J, Wettig A, et al. SWE-bench: can language models resolve real-world GitHub issues?[C]//Proceedings of the 12th International Conference on Learning Representations. 2024.
[19] Huang K H, Prabhakar A, Dhawan S, et al. CRMArena: understanding the capacity of LLM agents to perform professional CRM tasks in realistic environments[PP/OL]. arXiv (2025-02-16)[2026-10-20]. https://arxiv.org/abs/2411.02305.
[20] Drouin A, Gasse M, Caccia M, et al. WorkArena: how capable are web agents at solving common knowledge work tasks?[PP/OL]. arXiv (2024-07-23)[2026-10-20]. https://arxiv.org/abs/2403.07718.
[21] Gu J, Jiang X, Shi Z, et al. A survey on LLM-as-a-Judge[PP/OL]. arXiv (2025-10-19)[2026-10-20]. https://arxiv.org/abs/2411.15594.
[22] Kapoor S, Stroebl B, Siegel Z S, et al. AI agents that matter[PP/OL]. arXiv (2024-07-01)[2026-10-20]. https://arxiv.org/abs/2407.01502.